 FNOTrader Options Analytics — User Guide
Welcome to FNOTrader Options Analytics
This is a real-time terminal for Indian F&O options trading. It does two jobs, and this guide is split to match them:
- 1 · Options analytics — find and analyse trades: the live chain, straddle/strangle premium, open interest, Greeks exposure, scanners, FII/DII flows and events.
- 2 · Execution & copy trading — actually place and run them: build multi-leg strategies, fire them to a real broker (or the built-in paper account), monitor every running strategy with combined SL/target controls, and mirror one order across several accounts.
- 3 · Alerts — the bridge between the two: set a precise watch-and-notify rule once and the engine evaluates it every minute server-side, pinging you (toast / sound / Telegram / WhatsApp / webhook) — or placing the order for you — the moment it fires.
Pick your reading path
Demo paper
account to practise). Data refreshes every 3–5s during market hours; auto-refresh is
off-hours-aware.
Options primer — the bare essentials
Skip this if you already know what CE/PE, ATM/OTM/ITM, and Greeks mean. Otherwise, 5 minutes here saves hours of confusion later.
Calls (CE) and Puts (PE)
- CE = Call option — gives you the right to buy at a strike. Profits if spot goes up.
- PE = Put option — gives you the right to sell at a strike. Profits if spot goes down.
- You can buy (long, pay premium upfront) or sell (short, receive premium, take obligation). On Indian exchanges, sellers must post margin.
Strikes — ATM, OTM, ITM
Every contract has a "strike price" — the price at which the option can be exercised. Strikes are spaced in fixed steps (NIFTY: 50pt, BANKNIFTY: 100pt, SENSEX: 100pt).
- ATM (At-the-money) — strike closest to current spot.
- OTM (Out-of-the-money) — for CE, strike above spot; for PE, strike below spot. Cheaper, less likely to expire profitable.
- ITM (In-the-money) — for CE, strike below spot; for PE, strike above spot. More expensive, has intrinsic value already.
Premium = Intrinsic + Time value
The price you pay for an option (premium) has two parts:
- Intrinsic value — how much it's already in-the-money (₹0 for OTM options).
- Time value (extrinsic) — premium for the remaining uncertainty until expiry. Decays toward zero as expiry approaches (this decay is theta).
Greeks — the four numbers you watch
| Greek | What it measures | Quick read |
|---|---|---|
| Δ Delta | How much premium changes per ₹1 spot move | ATM ≈ 0.5 (CE) or −0.5 (PE). Deeper ITM → closer to ±1. Use to build hedges or directional bets. |
| Γ Gamma | How much delta changes per ₹1 spot move | Highest at ATM, especially near expiry. High gamma = rapid delta swings. |
| Θ Theta | How much premium decays per day | Negative for buyers, positive for sellers. Bigger near expiry. ATM straddle on expiry day decays ~half its value. |
| ν Vega | How much premium changes per 1% IV change | Higher for ATM and longer-dated options. Long vega benefits from rising IV; short vega benefits from falling IV. |
Implied Volatility (IV)
IV is the market's forecast of how much spot will move (in % annualized). High IV = expensive options; low IV = cheap. Compare today's IV to its recent range — the VIX index does this for NIFTY at the index level. The Strategy Builder shows IV per strike; the IV Skew column on the chain shows the spread between OTM-PE and OTM-CE IVs (positive skew = puts more expensive than calls = market pricing downside risk).
Top bar & navigation
The top bar is the same on every page:
| Control | What it does |
|---|---|
| Search | Type any underlying symbol (NIFTY, BANKNIFTY, SENSEX, RELIANCE, TCS, etc.). Auto-completes from the FNO universe. Selecting a symbol switches every page to that underlying. Current spot + day change shown next to symbol. |
| Expiry | Dropdown listing all live expiries for the symbol. Switches every page to that expiry. Weeklies first, then monthlies. |
| Prev Close / Day Open | Toggles the "change basis" used in every Δ column across the app. Prev Close = today's change since yesterday's close. Day Open = today's change since today's open (useful for intraday momentum reads). |
| Auto + 3s/5s/10s/30s | Auto-refresh toggle and interval. Default is 3s during market hours, paused outside. Refresh button forces an immediate reload. |
| Hover | Toggles the hover-preview chart that appears when you mouse over a CE/PE price cell on the chain or table pages. Off if you find it distracting. |
| Dark / Blue / Light | Theme. Persisted in your browser. |
| ? Help | Opens this user guide in a new tab. |
| Sign out | Clears your session locally AND on all sister apps (e.g., fp.fnotrader.com) via single sign-out. |
Menus — grouped by task
Pages are organised into top-bar menus — Dashboard, Analysis (chain, OI, Greeks, tape…), Straddle, Strategy (Builder, Terminal, Strategy View…), Stocks, Market (scanners & internals), Terminal, Brokers, Events and FII/DII. Everything in this guide is reachable from one of them.
1 · Options analytics
The find-and-analyse half of the platform. Every page below shows what it displays, what each control / column / colour means, and — most importantly — how a trader actually uses it to make a decision. Each one carries a mockup of the real prod UI so you know what you're looking at before you open it. Pages share the top-bar symbol and expiry, so switching either re-points the whole app.
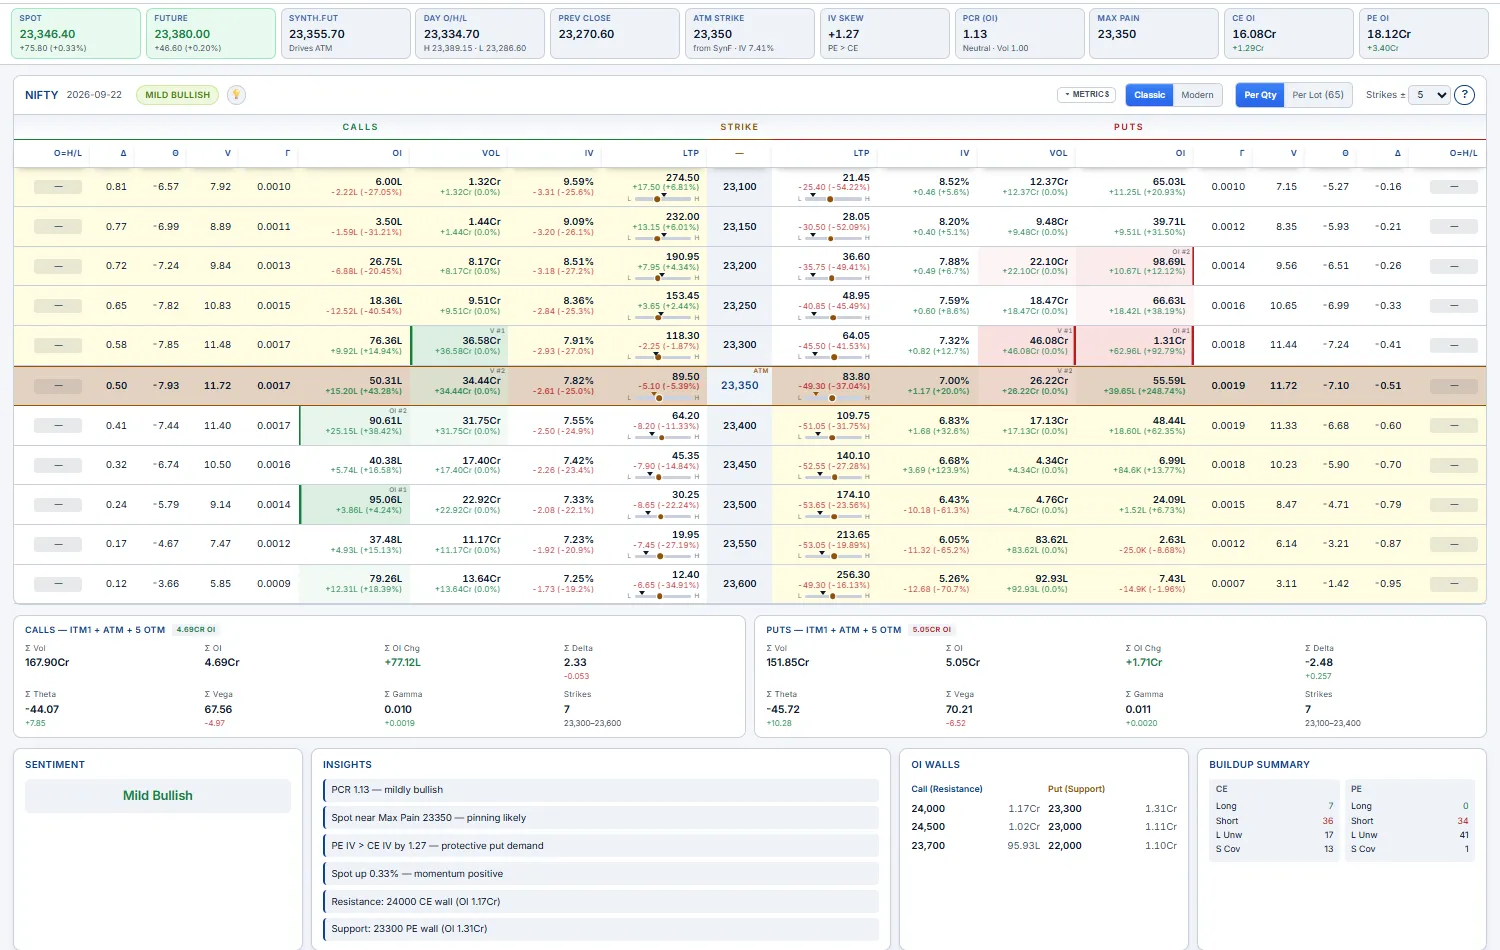
Option chain
The live CE/PE board for every strike around ATM — your home page. Calls on the left, the strike in the middle, puts on the right (NSE-style), updating tick-by-tick. This is where most traders start the day: read positioning, spot the walls, pick a strategy.
- The ATM row is highlighted amber. Above ATM: CE-OTM / PE-ITM; below ATM: CE-ITM / PE-OTM.
- Default per-side columns are
OI,LTP,Volume,IV,Δ. TheColumns ▾button toggles extras (CDV, Bid/Ask, Buildup tag, IV change, Vol change, OI change %, full Greeks Θ ν Γ). - The stat cards across the top —
SPOT,ATM Strike,IV Skew,PCR (OI),Max Pain,CE OI,PE OI— are computed live; several are clickable and jump you to the matching page. - Hover any LTP cell for an intraday mini-chart of that contract (VWAP/EMA overlays in the hover gear). Click the
Sentimentchip to expand the Suggested Strategies grid with concrete strikes.
- Abnormally high OI = a "wall" — spot gravitates toward it near expiry; trade it as support/target.
- Volume spike on one strike = algo/institutional flow — drill into it via Strike Charts.
- IV skew positive (puts richer) = downside fear priced in; PE-side premium-selling is fatter.
Straddle
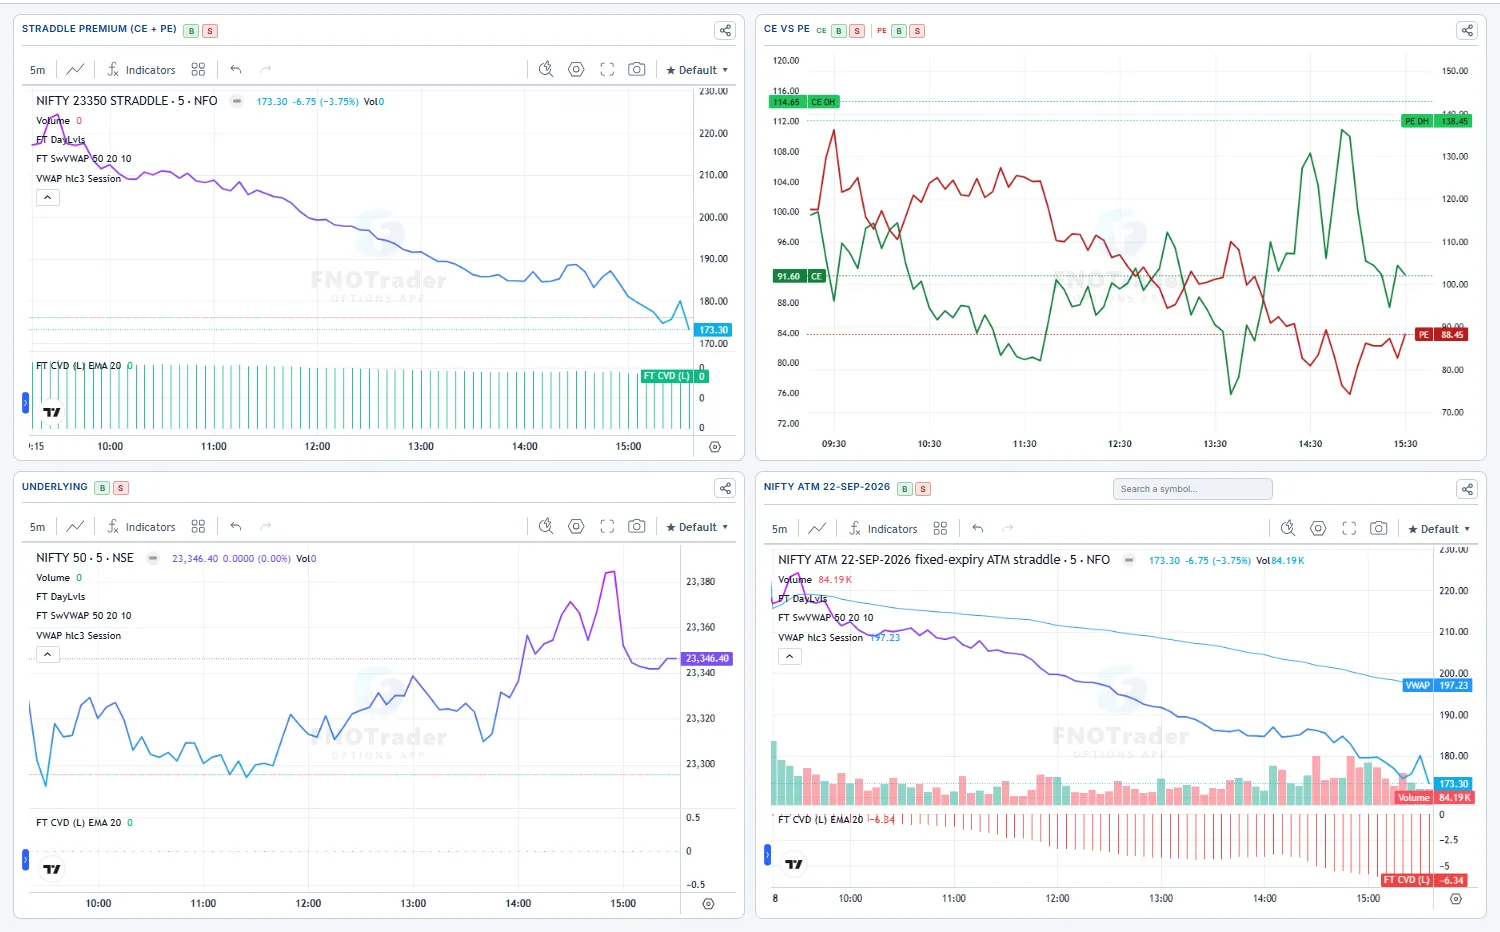
The ATM straddle premium (CE_LTP + PE_LTP) plotted intraday — the single most useful chart for option-sellers timing entries. It sums the two ATM legs bar-by-bar, so you watch the cost of the "buy both wings" position rise and fall in one line.
- Falling premium through the day = IV crush + theta winning → great for short-vol. Rising premium on flat spot = IV pop → long-vol / pre-event buys can pay.
- A
VWAPcrossover on the straddle premium is the classic intraday short-vol entry trigger.
- Chart type: line / mountain / baseline / candle (synthetic OHLC of the sum).
- Indicators:
VWAP,EMA10,EMA20,SuperTrend— each toggled independently; the y-axis is pinned so the chart doesn't jump when you toggle.
Strangle
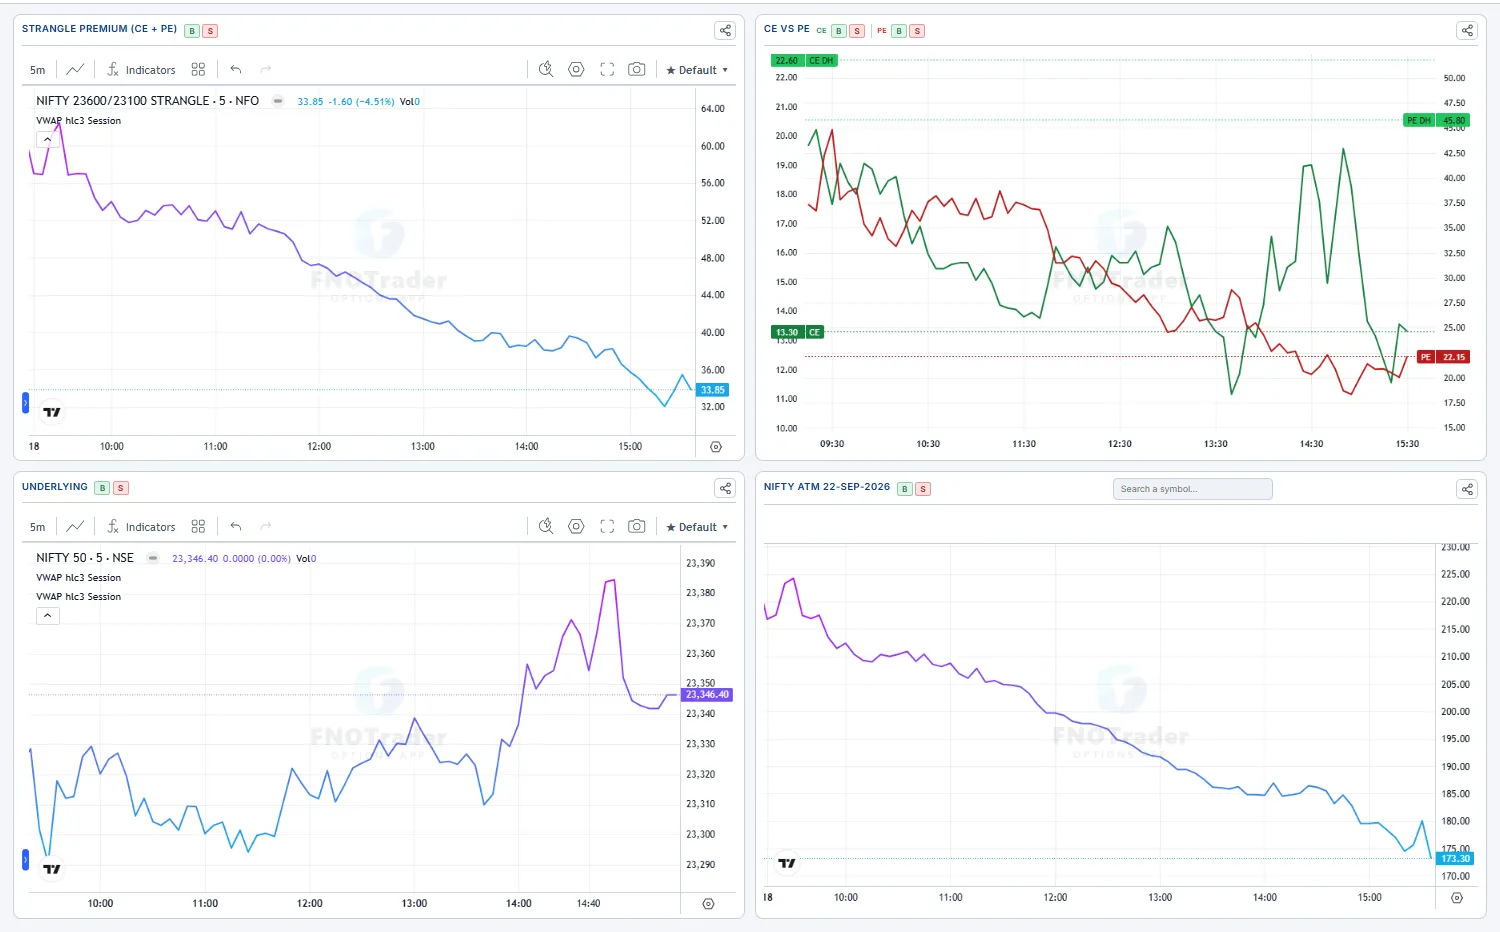
The same summed-premium chart as Straddle, but for two different strikes (OTM CE + OTM PE). Pick a middle strike and an offset — the chart plots the CE at middle + offset plus the PE at middle − offset intraday.
Use it to mark-to-market a strangle you've already sold, or to scout one before you sell it. A wider strangle decays slower but is safer; watch the live premium against VWAP/EMA to judge whether the position is bleeding the way you want.
- Middle strike + offset (e.g. ±5 strikes) set the two legs.
- Same chart types and
VWAP/EMA10/EMA20/SuperTrendindicator suite as the Straddle page.
Strike charts
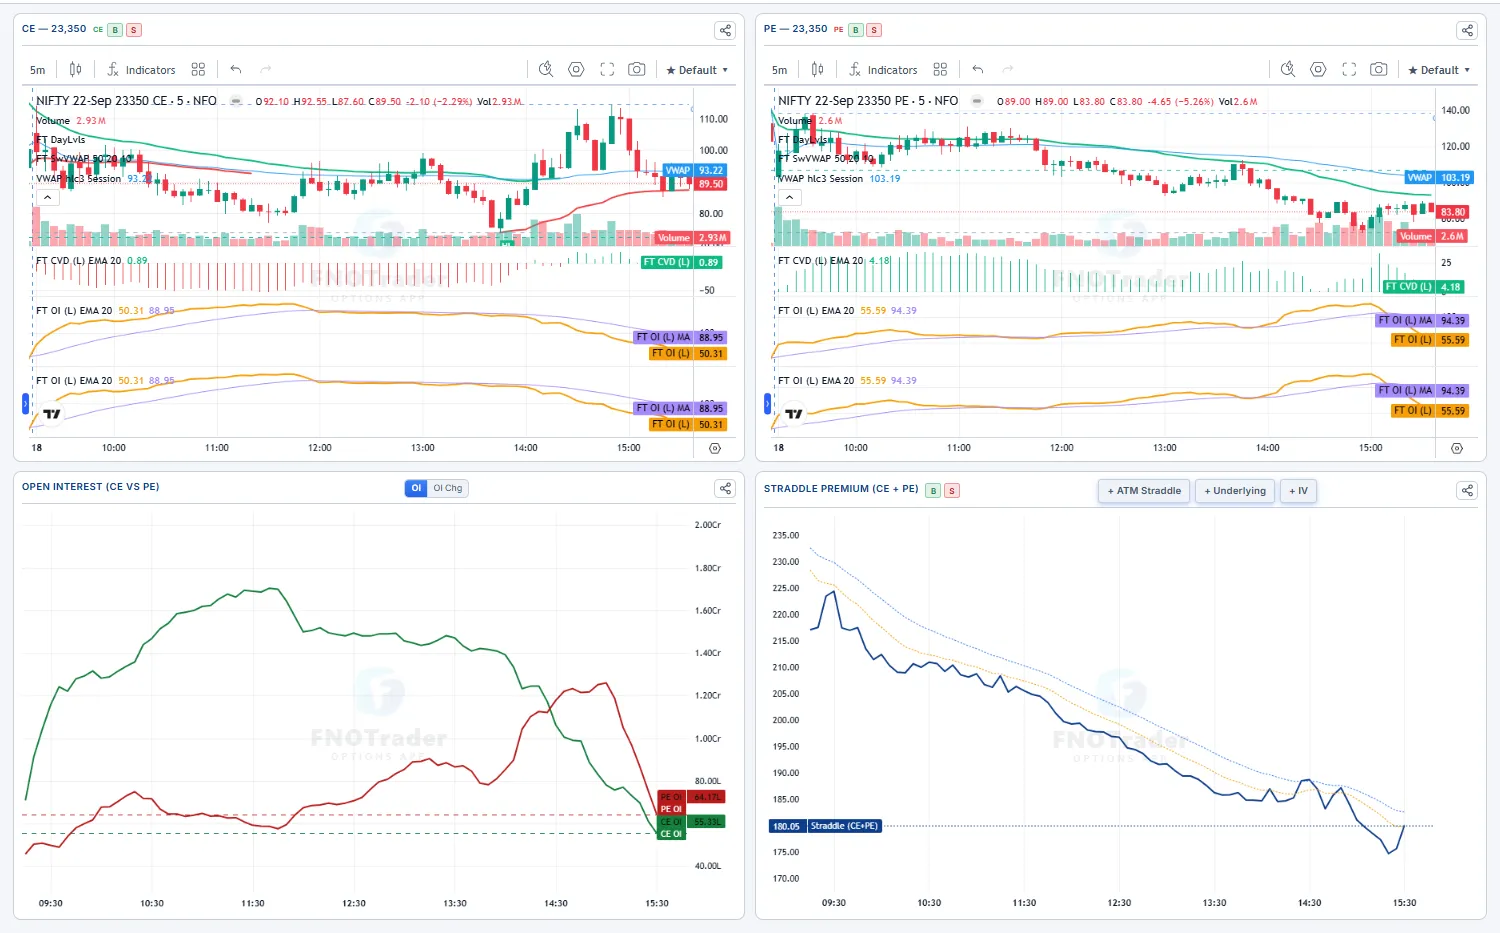
Pick any single strike and see its CE and PE intraday charts side-by-side with the full indicator suite. This is the "I want to study one specific contract" page — perfect for following up on a strike that flashed unusual volume or OI on the chain.
- Strike picker — searchable dropdown listing every strike around ATM with its current LTP.
- Timeframe — 1m / 3m / 5m / 10m / 15m / 30m.
- Chart type — line / mountain / baseline / candle, same as elsewhere.
- Indicators —
VWAP/EMA10/EMA20/SuperTrend, each toggleable per pane.
Straddle table
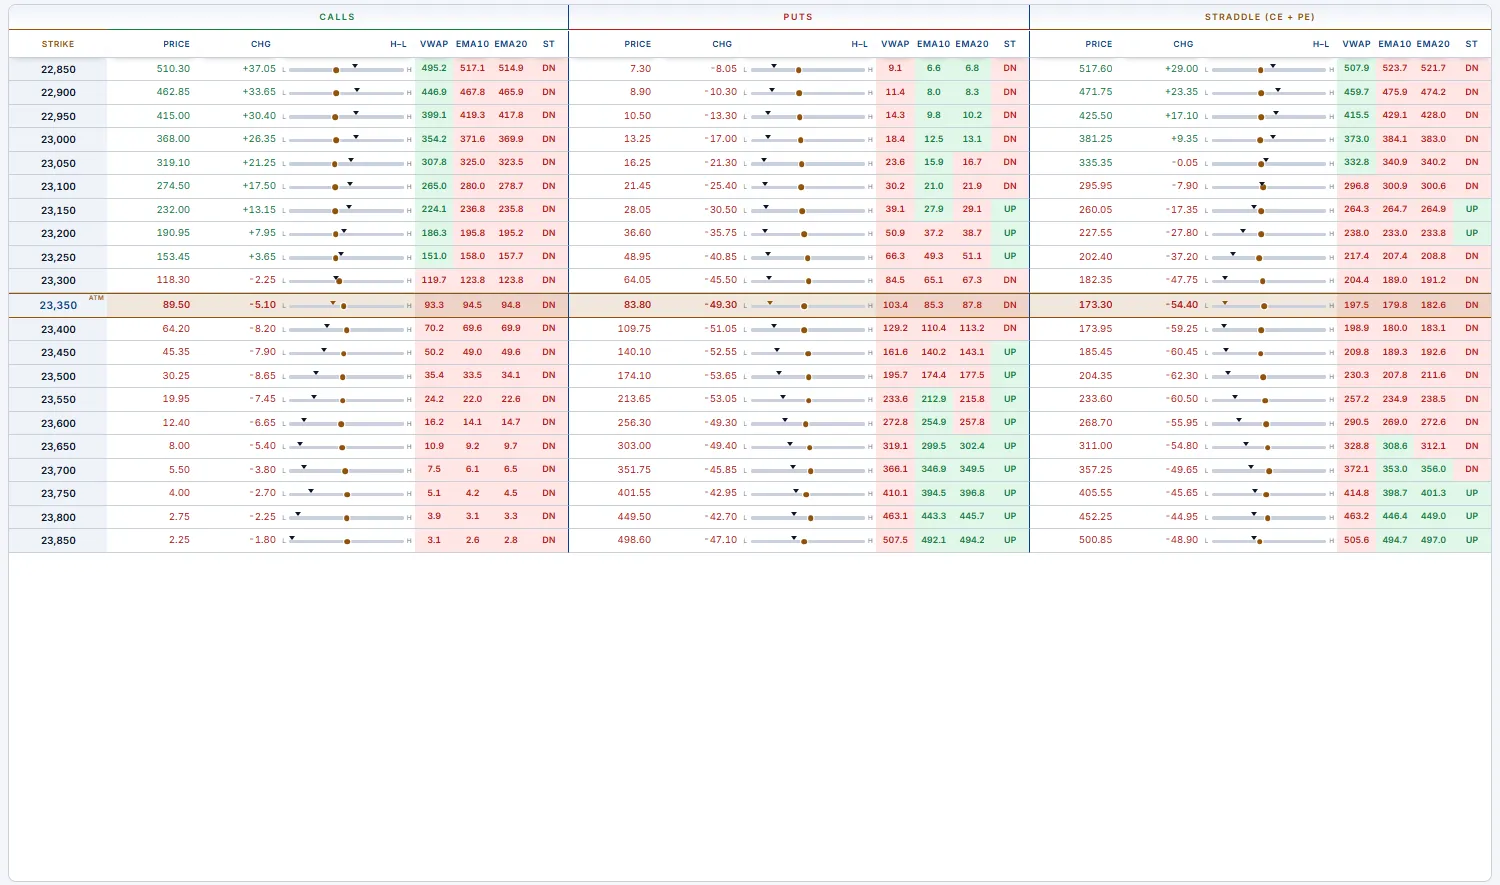
Three prices for every strike around ATM — CE, PE, and the Straddle (CE + PE) — each tagged against VWAP, EMA10, EMA20 and SuperTrend so a whole grid of strikes is readable at a glance. Instead of opening a chart per strike, you scan one table and instantly see which legs are trending up and which are dying.
| Tag | Meaning |
|---|---|
| VWAP ↑ / ↓ | Price above / below today's volume-weighted average — who's in control of that leg. |
| EMA10 / EMA20 ↑↓ | Short- and medium-term momentum direction. |
| ST ↑ / ↓ | SuperTrend up/down — the trend-follower's verdict. |
- A row with all-green CE + Straddle but red PE = a clean directional signal (calls running, puts dying) with no chart-flipping.
- Cells flash on a new intraday high or low, so breaks catch your eye even off-screen.
- The
Charttoggle swaps to a grid of 3 mini-charts per strike (CE / PE / Straddle) with the same overlays.
Strangle table
A board of independent strangle "instances" pinned side by side, all refreshing live together. Each instance tracks the same three series as the Straddle Table — CE (above the middle), PE (below the middle) and their sum, the Strangle (CE+PE) — with the same VWAP / EMA10 / EMA20 / SuperTrend tags, the same Table / Chart / Grid views and the same flash-on-extreme behaviour. Stack as many as you like; each carries its own timeframe, view and indicator set.
Why run several? To see which strangle — and which side of ATM — is decaying faster. That's the side the market doesn't expect to move toward, and where selling premium has the best risk-reward.
Three ways to build an instance (the buttons across the top toolbar):
- + Add Strangle — a symmetric ladder around a
Middle Strikeyou pick. TheOffsets ±Nstepper is how many concentric pairs to show, counting outward from the middle — it is not a wing width:±1= just the middle straddle (1 pair),±2= middle + the first OTM strangle (2 pairs),±N= N pairs. So one instance can show a whole ATM-outward ladder. - + Free CE/PE — an asymmetric instance where you choose the CE strike and the PE strike independently (e.g. CE 24,200 / PE 23,700). The middle-strike picker is hidden — use it for a skewed strangle that isn't centred on one strike.
- Auto-gen… — two one-click generators that build a curated set (both append; hit
Clearfirst if you want a fresh board):- ± levels — a fan of
2n+1instances centred on ATM, each one strike-step apart (the step is auto-detected: 50 for NIFTY, 100 for SENSEX). Tick skip-middle to drop each instance's ATM-straddle row so it shows OTM strangles only. - ATM ± distances — one pinned single-pair instance per distance you list (e.g.
6, 8, 10): each tracks exactly one far-OTM strangleCE@ATM+N / PE@ATM−N. Ideal for watching a fixed set of wing widths side by side.
- ± levels — a fan of
The board-wide Prev Close / Day Open toggle sets the baseline that every premium change is measured and coloured against, and the green DH tag on each pane is that series' engine-tracked running day-high.

Rolling ATM Straddle
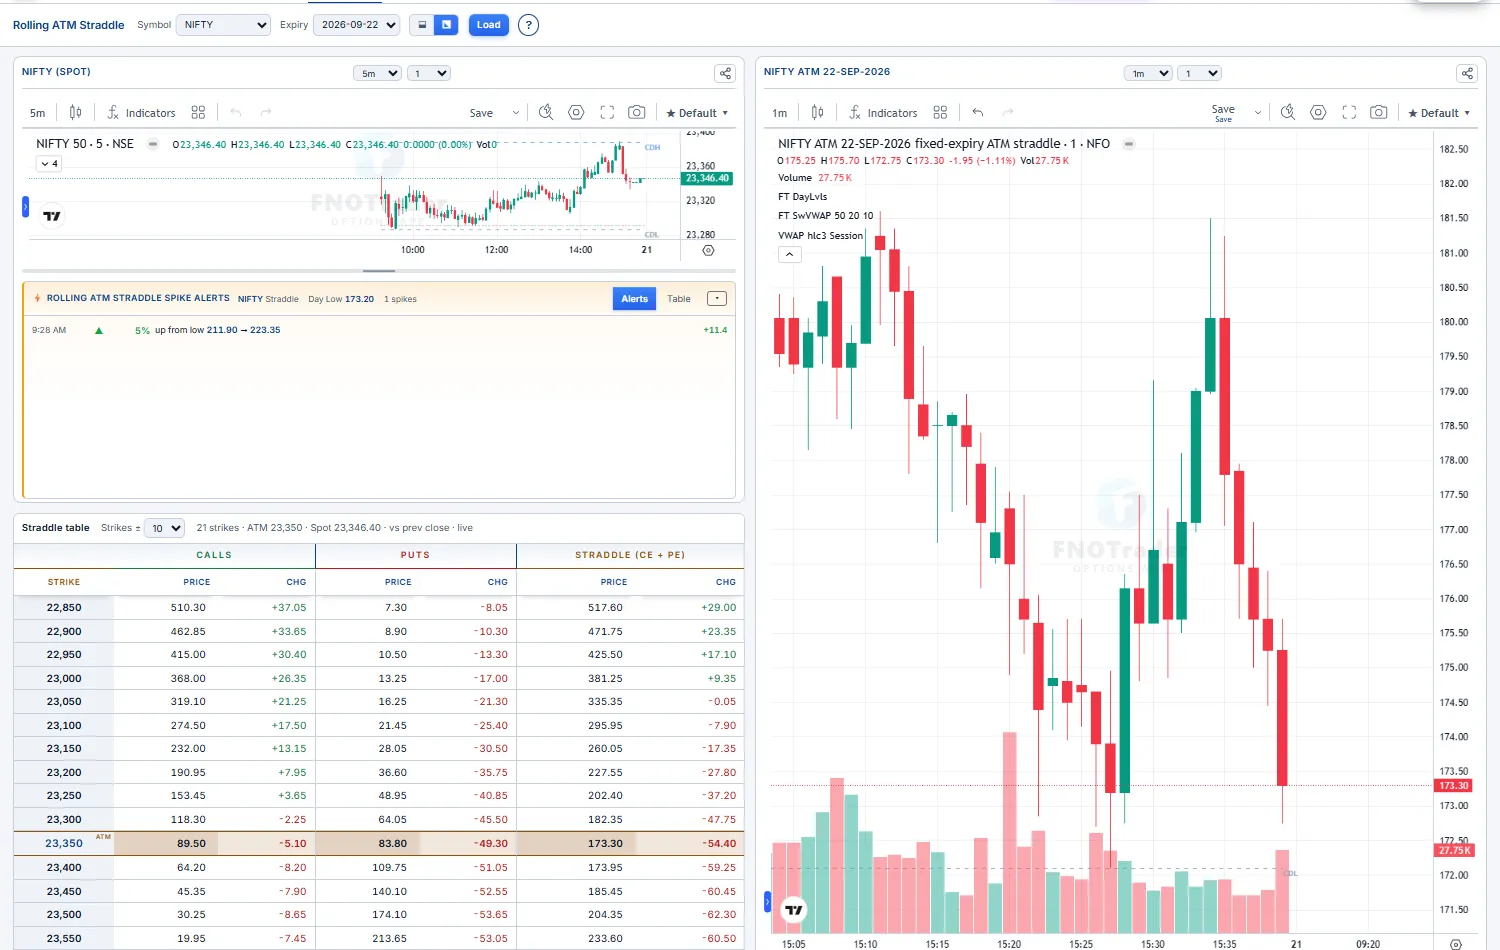
A clean multi-day candlestick chart of the current ATM straddle premium — the strike rolls with spot so you're always looking at the live ATM, not a strike that drifted away. A fixed-strike straddle chart gets noisy as spot moves; this synthetic instrument keeps re-centering, giving you a true picture of the IV regime across sessions.
Use it to swing-trade volatility: a rolling-ATM premium grinding lower day after day is a persistent short-vol regime; a sharp candle expansion flags an IV pop worth fading or riding.
- Symbol — NIFTY / SENSEX / BANKNIFTY plus the MCX commodities (GOLD, CRUDEOIL, NATURALGAS…); the synthetic ATM straddle is exchange-published.
- Expiry — which weekly/monthly's ATM to track. Timeframe — 1m / 5m / 15m / 30m / 1d.
- Each pane has its OWN timeframe, days and chart-type controls; default layout is the two panes side-by-side. Spike% overlays horizontal spike levels; the full indicator suite (
VWAP/EMA10/EMA20/SuperTrend) plus a paired underlying pane.
Open Interest
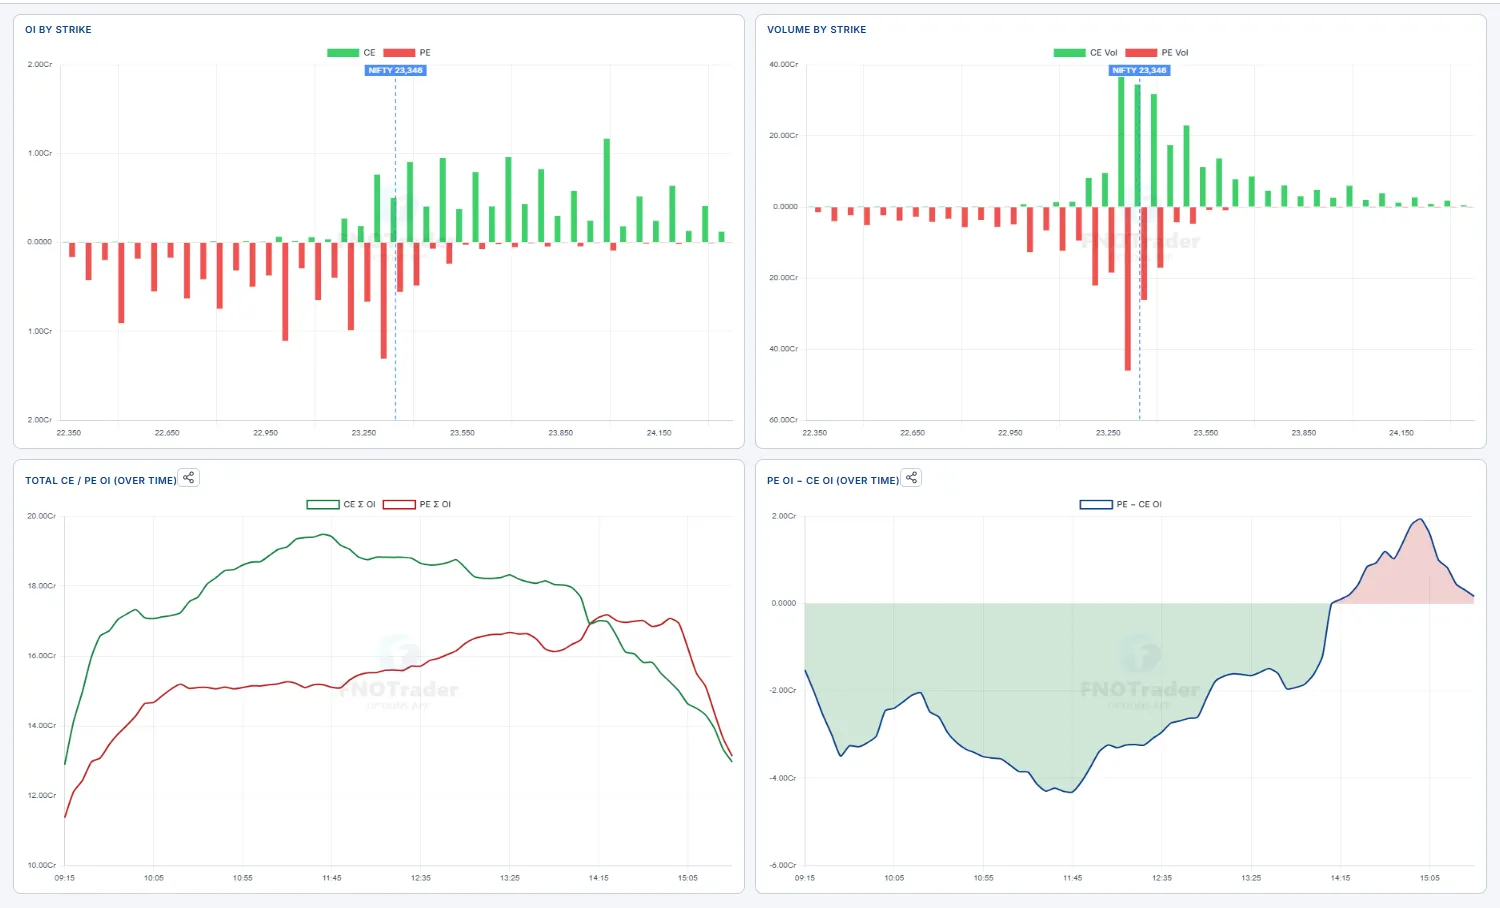
The OI distribution across strikes, CE vs PE, with a buildup tag per strike per side. It's the fastest read of where the big writers have parked their risk — and those strikes act as the day's magnets, walls and pins.
Read it as a battle map. Tall CE bars overhead are calls being written → resistance; tall PE bars below are puts being written → support. The buildup tag tells you whether that wall is being built (Short Buildup) or torn down (Short Covering) right now.
- Long Buildup — price up + OI up. Fresh longs.
- Short Buildup — price down + OI up. Fresh shorts / writing.
- Long Unwinding — price down + OI down. Longs exiting.
- Short Covering — price up + OI down. Squeeze.
Use the control bar to switch Total / Change / Both, flip Put above 0, set the Price line (Spot / Future / Synth.Fut), and frame the wing with Strikes ±.
Time-based analysis (OI playback)
A DVR for the option chain. Pick a date and a time window and replay how OI built and price moved through the session — minute by minute — or watch it live. The OI-diff ladder, the total-OI bars and a synced price chart all advance together.
A static chain only shows now. Replaying the day shows you when the call wall got stacked, when puts got unwound, and how price reacted — the read that tells you who's trapped and where the move actually came from.
- OI Diff ladder — per strike: solid = OI that stayed, hatched = OI added, hollow = OI shed over the window. Put = green, Call = red; a dotted line marks current price.
- View —
OI/Charts/Splitto show the ladder, the price chart, or both. - Transport —
⏮ ◁ ▶ ▷ ⏭with aSpeed(0.5× / 1× / 2× / 5×) and Start/End sliders for the replay window. TheInstrumentpicker (Spot / Future / CE / PE / CE-PE) + a strike box drives the chart, withEMA10/EMA20/VWAP/OItoggles. - Leave End at the right edge during market hours for a
● livefeed.
▶ and watch where OI piles on vs where price goes — a wall that keeps growing while price stalls into it is real resistance; OI shedding hard as price breaks out is a short squeeze fuelling the move.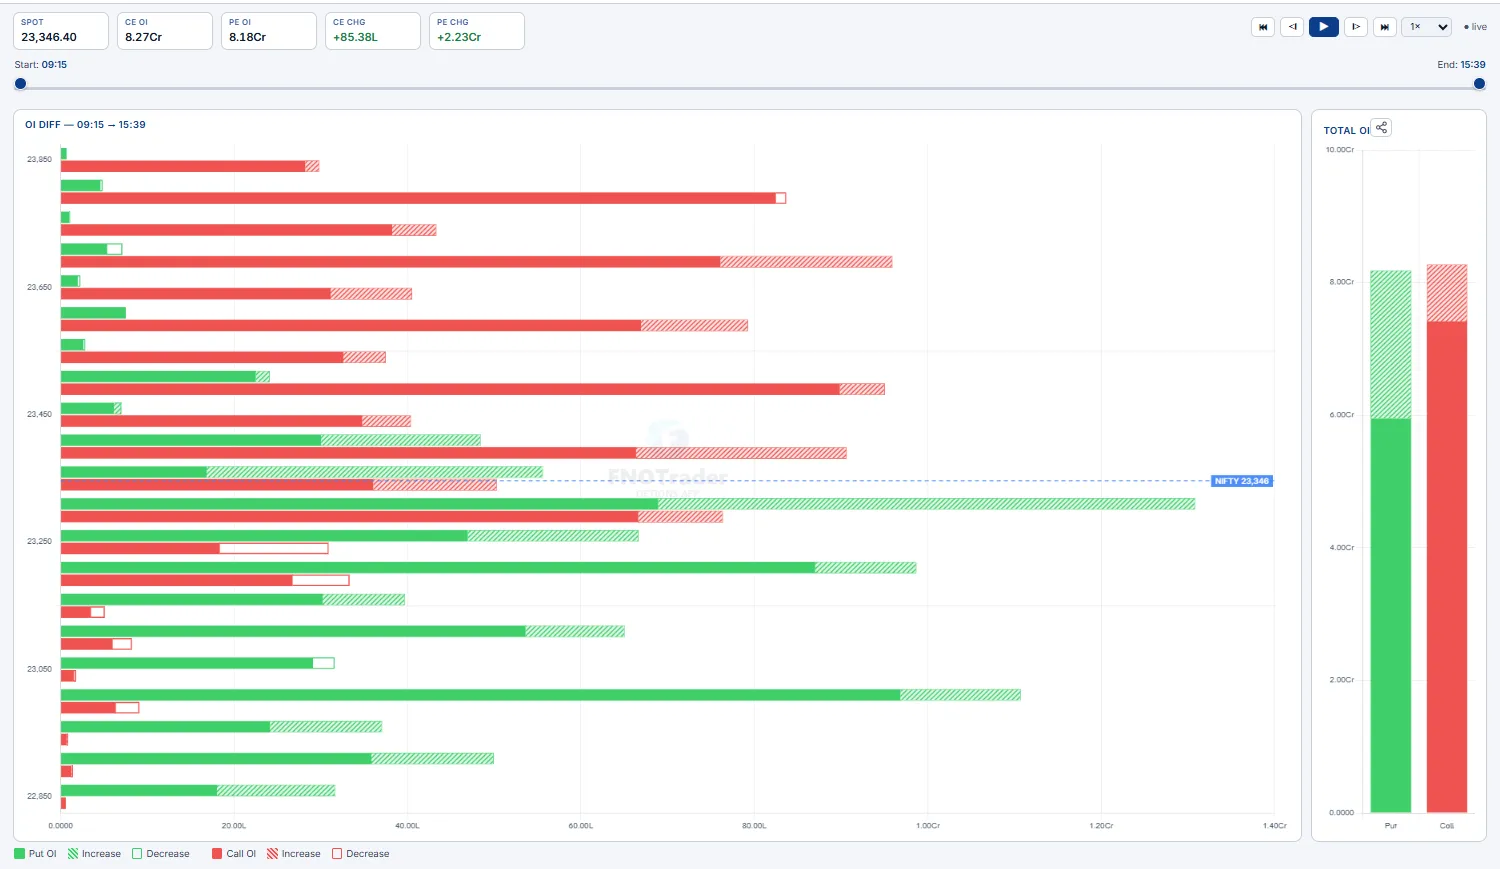
Greeks exposure — GEX / DEX / TEX / VEX
Aggregate dealer greek exposure across every open contract, per strike. It tells you which regime the market is in — pinned (vol dampened) or trending hard (vol amplified) — and where the structural pivots, walls and the day's expected range sit.
The key pane is Gamma Exposure (GEX) with its cumulative curve and zero-gamma flip line. Above the flip dealers are long gamma → they sell rallies and buy dips, suppressing the move (pin). Below it they're short gamma → they chase, accelerating moves. DEX (delta), TEX (theta) and VEX (vega) panes round out the positioning.
- Controls —
Size: OI/Size: Volume,Price line(Spot / Future / Synth.Fut),Strikes ±window. - Summary strip —
Net GEX,Max Pain,GEX Pin,Call Wall,Put Wall,Expected Range,Zero-Gamma Flip, plus the positioning tiles described in Summary strip.
GEX Pin nearby → fade extremes, expect mean-reversion into the pin. Spot below the flip (short gamma) → respect breakouts, momentum runs further than it "should."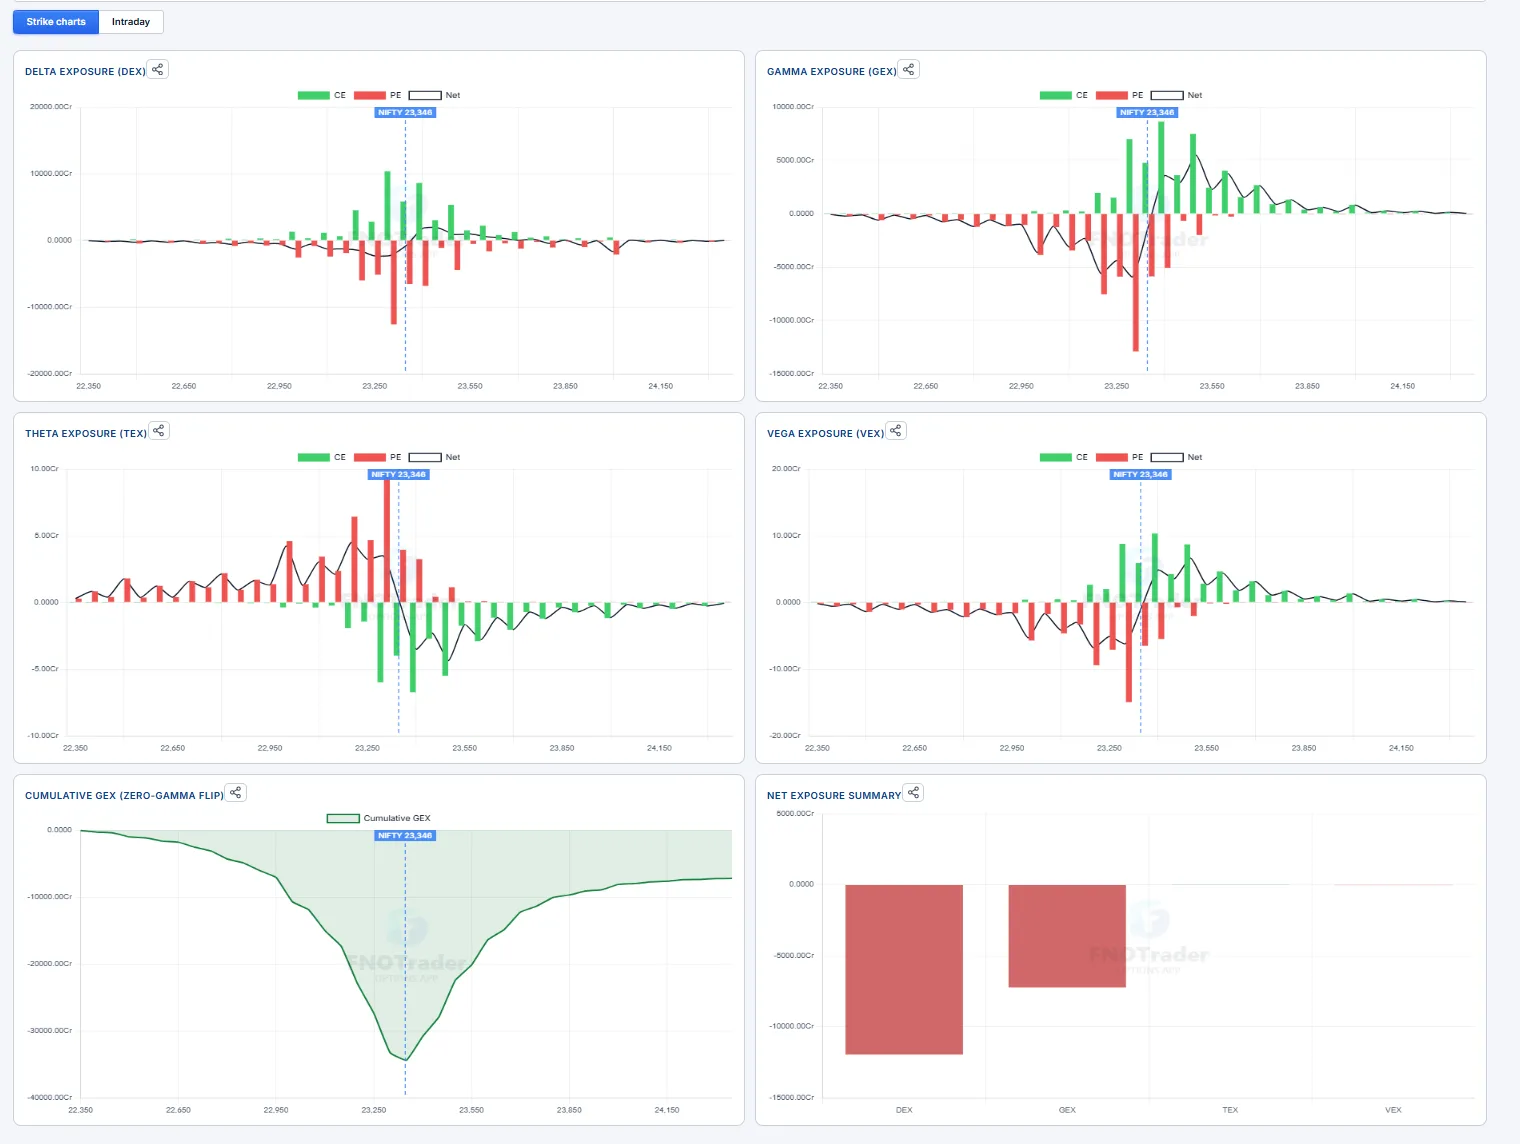
Page layout — Strike charts & Intraday
The page opens with the summary strip and the Insights card, then two tabs:
- Strike charts — where positioning sits right now, strike by strike (DEX / GEX / TEX / VEX, cumulative GEX, net summary).
- Intraday — how that positioning has moved through the session: Intraday Net GEX, Intraday Net DEX, Vanna & Charm and the day's paper strategy. Everything on this tab is computed over the whole chain of the selected expiry and updates live, tick by tick.
Think of the Strike charts as the map (where the walls and magnets are) and the Intraday tab as the weather (whether conditions are getting calmer or stormier, and who is driving it). The page remembers the tab you last used; hover a title or number for a one-line reminder.
Summary strip — every tile
The strip is the one-glance read of the chain. The first row describes where positioning sits; the second row describes how it is changing today.

| Tile | What it conveys | How traders read it |
|---|---|---|
| Net DEX | Net delta of the open book across the strikes in view — which way the options book leans. | Large negative = put-heavy book; large positive = call-heavy. Compare with DEX flow to see whether today is adding to or unwinding that lean. |
| Net GEX | Net dealer gamma across the strikes in view. | Positive → dealers dampen moves (sell rallies, buy dips); negative → they amplify moves. Sets your expectation of a range day vs a trend day. |
| Net TEX | Theta (time decay) on the call side vs the put side. | Shows which side is paying the most decay per day — where option buyers are bleeding and writers are collecting. |
| Net VEX | Vega on the call side vs the put side. | Which side gains most if IV rises. A strongly one-sided VEX means an IV spike or crush hits that side hardest. |
| Futures / Options expiry | The futures contract and the option expiry the page is reading, with their prices. | Confirms which contract the levels refer to — on MCX the options settle on their contract-month future. |
| Max Pain | The strike at which option holders collectively lose the most (writers pay out the least). | Price often drifts toward it into expiry, especially when gamma is positive. Weaker signal far from expiry. |
| GEX Pin | The strike with the most total gamma (calls + puts). | Acts as a magnet — heavy hedging there tends to pull price toward it and hold it. |
| Call Wall / Put Wall | Strike above spot with the most call gamma / strike below spot with the most put gamma. | Typical resistance / support for the session. A clean break through a wall with gamma turning negative often extends. |
| Expected Range | Put wall → call wall. | The zone the options market expects to contain the day. Fade the edges in a positive-gamma regime; respect breakouts in a negative one. |
| Zero-Gamma Flip | The price level where cumulative gamma changes sign. | The regime line: above it moves tend to be damped, below it amplified. |
| GEX Regime | Spot vs the flip — Positive above, Negative below. | The quick answer to "mean-reversion day or momentum day?" |
| Sized by | Whether the strike charts weight by open interest or by today's volume. | OI = the standing book; Volume = where today's trading happened. Switch to Volume to see intraday activity. |
| Spot vs Flip | Points and % between spot and the flip. | Small distance = the regime can change on a modest move — widen stops. Large distance = the regime is stable. |
| Call wall moved / Put wall moved | Where each wall was at the first tick vs now. | Call wall up = resistance rebuilt higher (room to rally). Put wall up = support rising with price. Put wall down = support giving way; call wall down = the ceiling is closing in. |
| GEX since open | How much gamma today's trading has added or removed (whole chain). | Rising = more pinning / calmer tape; falling = moves can start to expand. |
| DEX flow | The delta of positions opened or closed today. | Today's fresh positioning. Flow in the direction of price = the move is backed; flow against price = the move lacks option support. |
| DEX convergence | Whether today's flow has the same sign as the standing book. | Same sign = positioning reinforcing; Opposite = fresh positioning fighting the carried-in bias (often choppy). |
| Book Δ (fut lots) | The whole book's net delta expressed as index-futures lots. | A concrete size for the lean — how many futures would carry the same exposure. |
| GEX Concentration | How bunched gamma is across strikes. | Concentrated = a few strikes dominate → strong magnets and sharp reactions at them. Balanced = spread out, weaker pins. |
Strikes ± window and the Size setting, like the strike charts. The Intraday tab and the second-row tiles use the whole chain weighted by open interest — so the same measure can show a different number. Both are right for what they cover.Strike charts — pane by pane
Each pane is a bar per strike: calls in green, puts in red, and a line for the net. The dotted vertical line is the current price reference (Spot / Future / Synth.Fut).
| Pane | What it conveys | How traders read it |
|---|---|---|
| Delta Exposure (DEX) | Delta held at each strike (puts negative). | The tallest bars are where directional positioning sits — often levels price reacts to. A net line that is negative across most strikes = put-heavy book. |
| Gamma Exposure (GEX) | Hedging intensity at each strike (calls +, puts −). | Tall green above spot = call wall (resistance); tall red below spot = put wall (support). Where the bars are biggest, hedging flows are biggest. |
| Theta Exposure (TEX) | Time decay at each strike, call side vs put side. | Shows where decay is concentrated — the strikes writers are most exposed to and buyers are paying for. |
| Vega Exposure (VEX) | Sensitivity to a 1% IV move at each strike, call side vs put side. | Where an IV spike or crush lands hardest — relevant around events and results. |
| Cumulative GEX | Gamma added up from the lowest strike to the highest. | Where the curve crosses zero is the zero-gamma flip. Spot well above the crossing = stable damped regime; near it = fragile. |
| Net Exposure Summary | One bar per greek — the net total of DEX, GEX, TEX, VEX. | A quick sign check: which way the book leans and whether it dampens or amplifies moves. |
Insights — GEX · DEX · Vanna · Charm
Plain-language conclusions drawn from the numbers, refreshed with every tick. Colour tells you the tone — green supportive / damped, red amplified / weakening, amber caution or mixed. Each tab shows how many reads are active.

| Insight | What it means | How traders use it |
|---|---|---|
| Damped (GEX) | Net GEX positive and spot above the flip — dealers sell rallies and buy dips. | Expect a range; fade moves into the walls; option selling tends to work. |
| Amplified (GEX) | Net GEX negative and spot below the flip — hedging chases the move. | Expect trends and breakouts; don't fade strength or weakness; wider stops. |
| Mixed gamma (GEX) | Total gamma and the gamma near spot disagree. | Uneven, whippy behaviour is likely — reduce size until the two agree. |
| Range / Outside walls (GEX) | Where spot sits between the put and call walls — or that it has left them. | Near the top of the range = resistance close; outside the walls = the wall is being tested or broken. |
| Gamma building / bleeding (GEX) | How Net GEX changed over the last 30 minutes. | Building = pinning strengthening (calmer). Bleeding = support for calm is fading; moves can expand. |
| Positioning aligned / split (DEX) | Today's flow vs the standing book. | Aligned = conviction; split = fresh positioning fighting the carried-in bias. |
| Flow confirms / diverges (DEX) | Today's price move vs the delta of fresh positions. | Diverges = the move lacks option support and is more likely to fade. |
| Bias sits elsewhere (DEX) | The biggest delta is in another expiry. | This expiry tells only part of the story — check the term structure. |
| IV sensitivity / IV-sensitive | How far the book's delta moves for a 1-point IV change, and the futures hedging that implies. | If large, an IV crush (calm, post-event) or spike (sell-off) alone can move price through hedging. |
| Charm into close / Charm per day | Delta drift from time decay alone — over the rest of the session and per day. | Explains afternoon drift and overnight re-hedging; strongest near expiry. |
| Vanna hotspot | The strike where IV and time effects concentrate. | Expect the most re-hedging — and often a magnet — around that strike. |
| Expiry close | Two days or less to expiry. | Charm dominates; pinning to big strikes and late-day drift are strongest. |
Intraday Net GEX
What it conveys: whether dealer hedging is making the market calmer or more volatile — and how that has changed since the open. Recomputed across the whole chain every 1m–15m (the Every selector), live between points. Pick a recent Date to replay a past session.
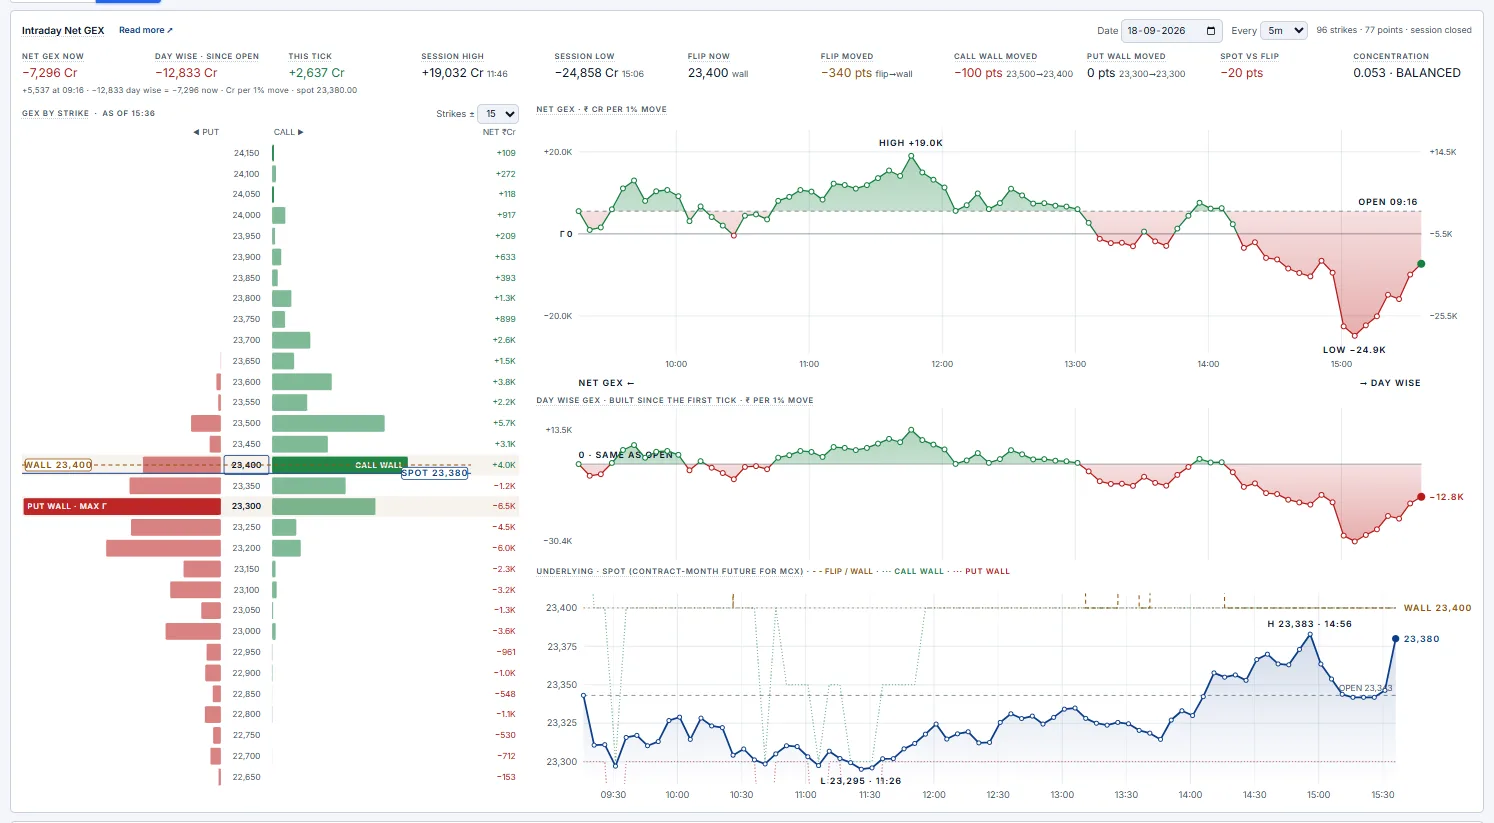
- Stats row — the current values plus how they moved today: Net GEX now, change since open, this tick, session high / low (with times), flip now and how far it moved, call / put wall moves, spot vs flip, concentration.
- GEX by strike — the live strike profile: puts left, calls right, net on the right (
NET ₹Cr, or₹Lon MCX). Call wall, put wall and MAX Γ are highlighted; solid line = spot, dashed amber = flip. Read it as a map: walls are the fences, MAX Γ is the magnet. - Net GEX chart — read against the Γ 0 line. Above it the market is being calmed; below it moves are being amplified. The dashed OPEN line is where the day started (green fill above, red below).
- Day-wise chart — the same line with the open as zero: it isolates what today's trading did to gamma.
- Underlying — price on the same clock with the flip (dashed amber) and walls (dotted green / red), so you can see how price reacted at each level.
Spot up, Net GEX down — hover a point and compare CE vs PE. Call gamma falling = calls being closed → a short-covering rally that tends to fade once covering is done. Put gamma rising instead = put writers building support under the move.
Spot down, Net GEX down — selling into falling gamma: support is thinning and moves can accelerate, especially below the flip.
Spot down, Net GEX up — dips are being absorbed; buyers of dips have dealer flow on their side.
Intraday Net DEX
What it conveys: which way the options book leans, how much hedging sits behind that lean, and whether today's trading agrees with it.
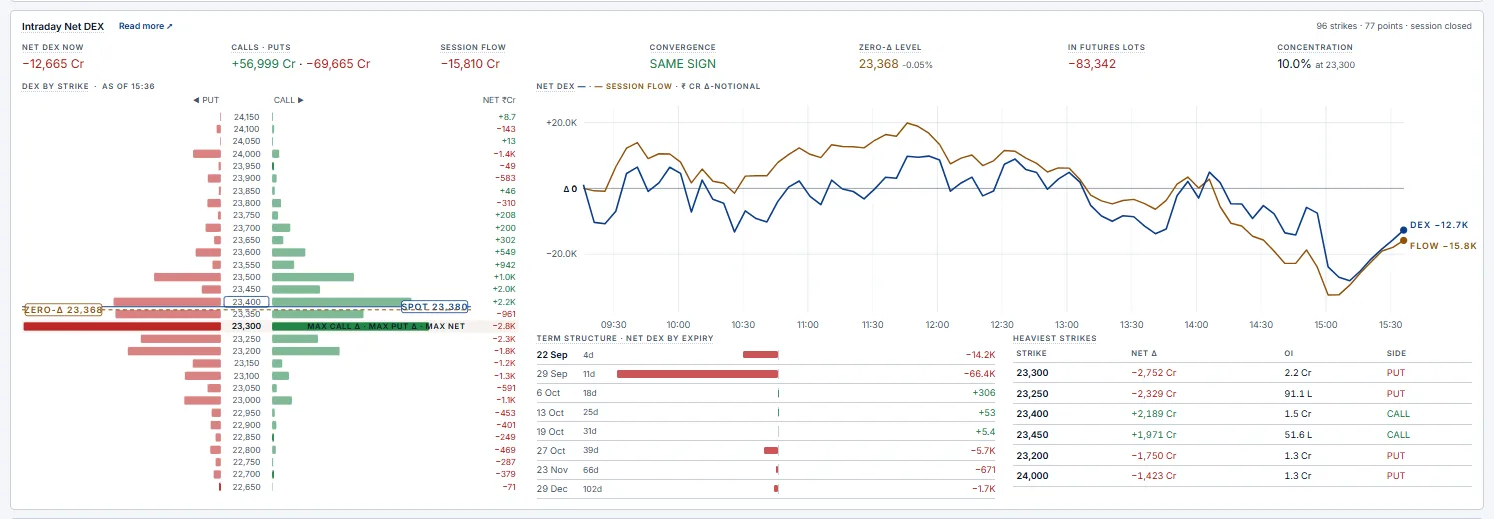
- Net DEX / Calls · Puts — the lean and its two sides (puts carry negative delta, so Net = Calls + Puts).
- Session flow — the delta of positions opened or closed today. This is the most useful line on the card: it shows what the market is doing, not what it carried in.
- Convergence — flow and book agree (reinforcing) or disagree (choppy).
- In futures lots / Concentration — the lean expressed as futures, and how much of it sits in one strike.
- DEX by strike — where the directional positioning is; the heaviest strikes often act as levels.
- Net DEX & session flow chart — the two lines through the day.
- Term structure / Heaviest strikes — which expiry carries the bias and which strikes hold it.
Price up, flow down — the rally isn't backed by new option positions (divergence) — often a fade.
Flow against the standing book — the day's traders are fighting the carried-in bias; expect two-way, choppy trade.
Bias only in the front expiry — it fades at that expiry; a lean spread across monthlies is more durable.
Vanna & Charm exposure
What it conveys: the hedging that happens without price moving — driven by changes in volatility (vanna) and by the clock (charm).
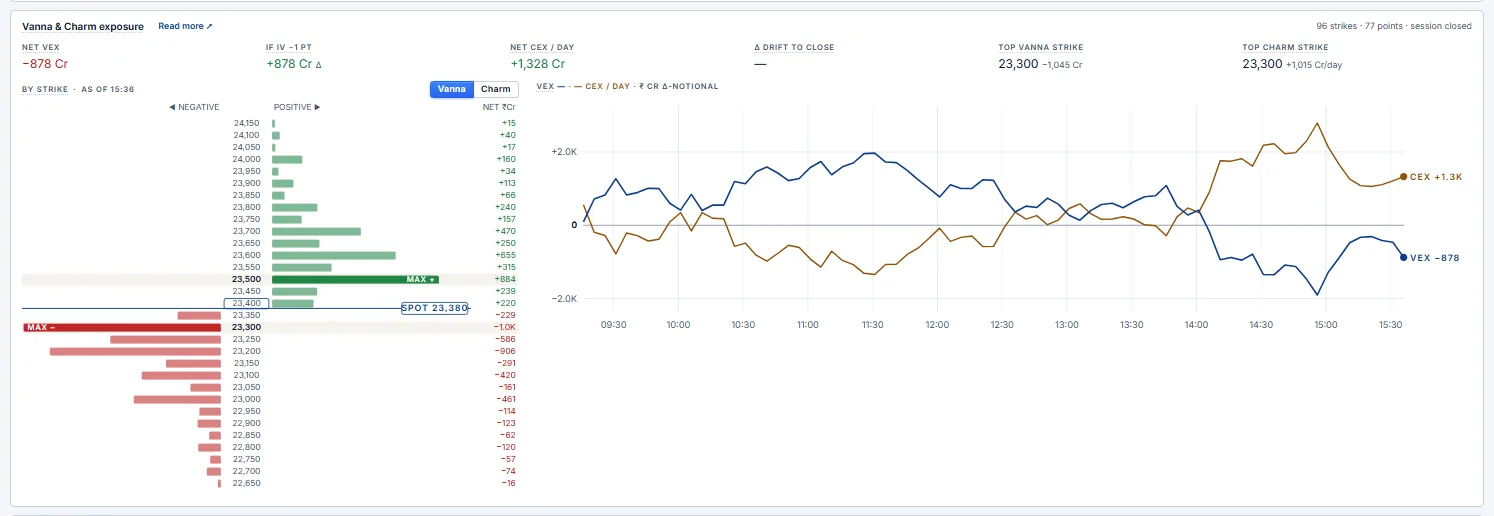
- Net VEX / If IV −1 pt — how much the book's delta changes if IV rises / falls by one point.
- Net CEX / day and Δ drift to close — how much the book's delta drifts from time passing — per day, and over what is left of today's session.
- Top vanna / charm strike and the by-strike view (toggle
Vanna/Charm) — where these effects concentrate. - VEX & CEX chart — both through the day; CEX usually grows into the afternoon and into expiry.
Charm into close large vs the book — expect steady hedging in one direction through the afternoon; pinning to big strikes is common on expiry days.
Vanna hotspot near spot — IV swings produce the biggest hedging right where price is, adding to the pull of that strike.
Strategy — today's paper trade
What it conveys: a live, rule-based test of the regime signal — one paper position a day, so you can judge how the gamma read plays out. Nothing is sent to a broker.

- At 09:31 the regime is read from the selected expiry; the trade enters at the 09:32 price, one lot per leg, and exits at 15:15.
- Positive gamma (Net GEX > 0, spot at or above the flip) → sell a strangle at the call / put walls — the range play; stop if the premium rises 50%.
- Negative gamma (Net GEX < 0, spot below the flip) → buy the ATM straddle — the volatility-expansion play; stop −25%, target +40%.
- Mixed → no trade.
The card marks each leg to market, shows the combined premium and P&L before costs, the stop / target levels, and whether the regime has changed since 09:31. Use it to build intuition for how often the morning read holds — not as a signal to copy.
Reading the market — a playbook
| What you see | What it usually means | How traders approach it |
|---|---|---|
| Positive gamma, spot between the walls, concentration high | A pinned, mean-reverting day around the magnet strike. | Fade moves into the walls; premium selling tends to work; don't chase breakouts. |
| Negative gamma, DEX flow in the direction of price | A trend day — hedging adds fuel to the move. | Trade with the move; avoid fading; wider stops. |
| Spot rising, call gamma falling, flow turning negative | Short-covering rally. | Momentum can be sharp but usually fades once covering is done; watch the call wall. |
| Spot rising, put gamma rising, put wall moving up | Put writers building support under the rally. | Dips toward the rising put wall tend to be bought. |
| Spot falling toward the put wall, gamma bleeding | Support weakening. | A break of the put wall can accelerate — respect it rather than buying the dip. |
| Mixed gamma or spot very close to the flip | The regime can flip on a small move. | Reduce size; wait for a clear side of the flip. |
| Expiry within two days, large charm, big GEX pin | Pinning and late-day drift dominate. | Expect price to gravitate to the pin into the close; be careful holding short-dated options against it. |
| IV collapsing after an event, large VEX | Vanna-driven hedging. | Expect drift in the direction the re-hedging implies even without news. |
Definitions
| Measure | How it's computed |
|---|---|
| GEX (per strike) | (ΓCE × OICE − ΓPE × OIPE) × spot² × 1% — ₹ of hedging per 1% move. Net GEX = sum over all strikes. |
| Zero-gamma flip | Running sum of GEX from the lowest strike up; the flip is where it crosses zero nearest to spot. With no crossing, the regime-side gamma wall is shown and labelled wall. |
| Call / put wall | Strike at or above spot with the largest call Γ × OI / strike at or below spot with the largest put Γ × OI. |
| Concentration | Sum of each strike's squared share of |GEX| (0 = evenly spread, 1 = one strike). Under 0.15 balanced, 0.15–0.30 clustered, above 0.30 concentrated. |
| DEX | Σ Δ × OI × spot (puts negative). Deep-in-the-money contracts use Black-76 delta from their price when the feed carries none. |
| Session flow | Σ Δnow × (OInow − OIopen) × spot. |
| VEX | Σ vanna × 1% × OI × spot, vanna = ∂Δ/∂σ (Black-76). |
| CEX | Σ charm × OI × spot per calendar day, charm = change in Δ as time passes (Black-76). |
₹35.2 L), and the strike-ladder NET column states its unit.Composite chart
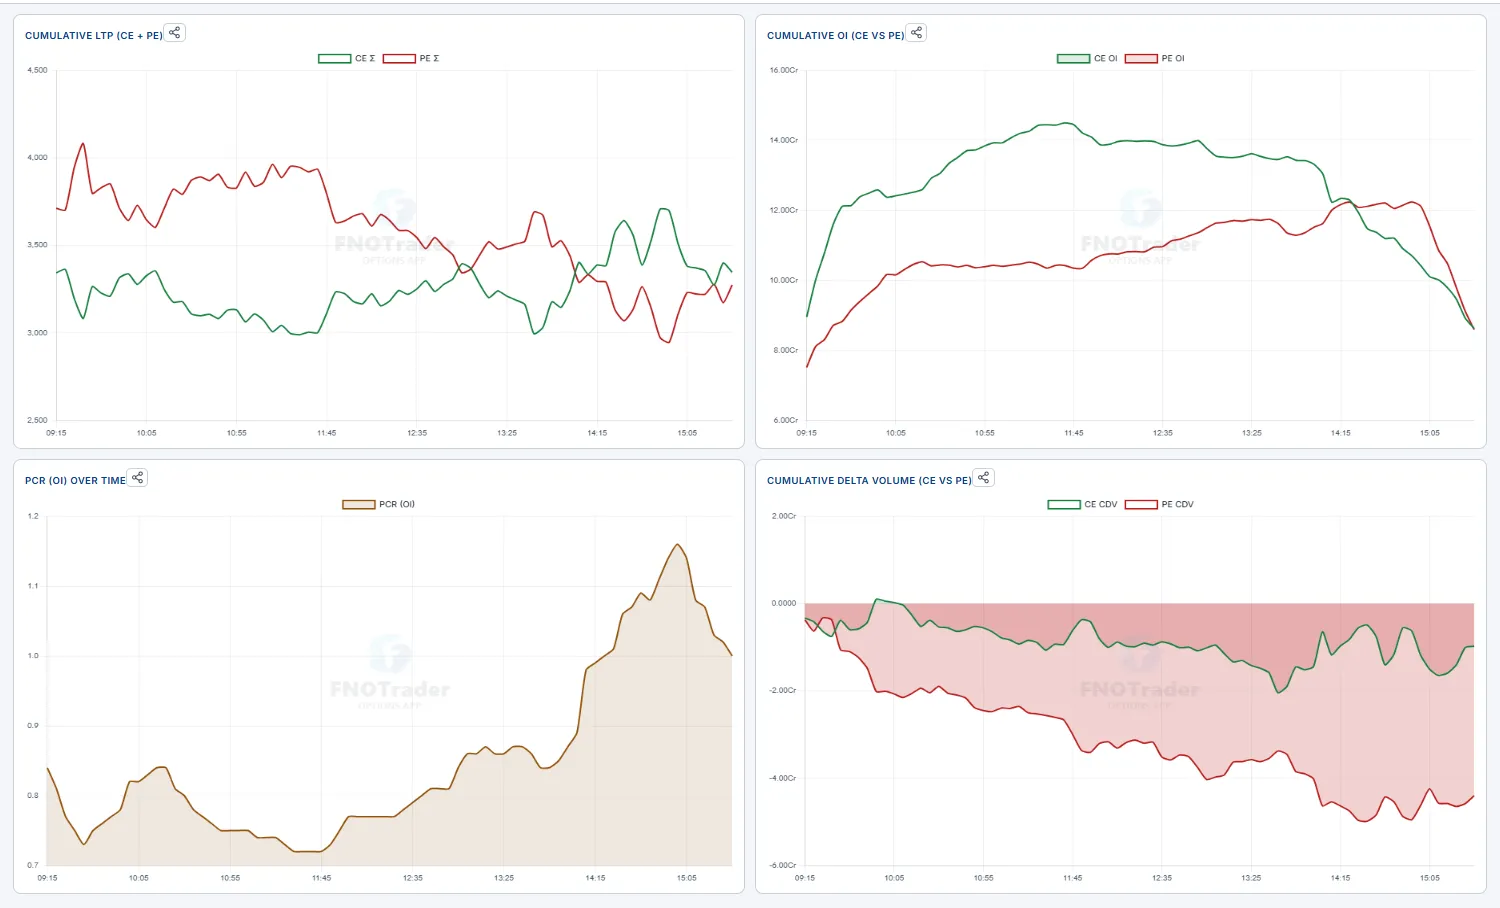
A multi-pane intraday chart that overlays the options-derived metrics on one time axis. It's the context page — it answers "is this move backed by the options market, or fighting it?" without flipping between five screens.
Four stacked panes share the clock: Cumulative LTP (CE Σ vs PE Σ), Cumulative OI (CE OI vs PE OI), PCR (OI) over time, and Cumulative Delta Volume (CE CDV vs PE CDV). When call premium and call CDV both lift while PE OI builds, the flow agrees with the up-move; divergence is your warning.
- Mode —
Total/Δ Day Open/Δ Prev Close. - Interval 1m–30m,
Days1–2,RangeATM ± 10 / ± 20 / All.
Intraday tape
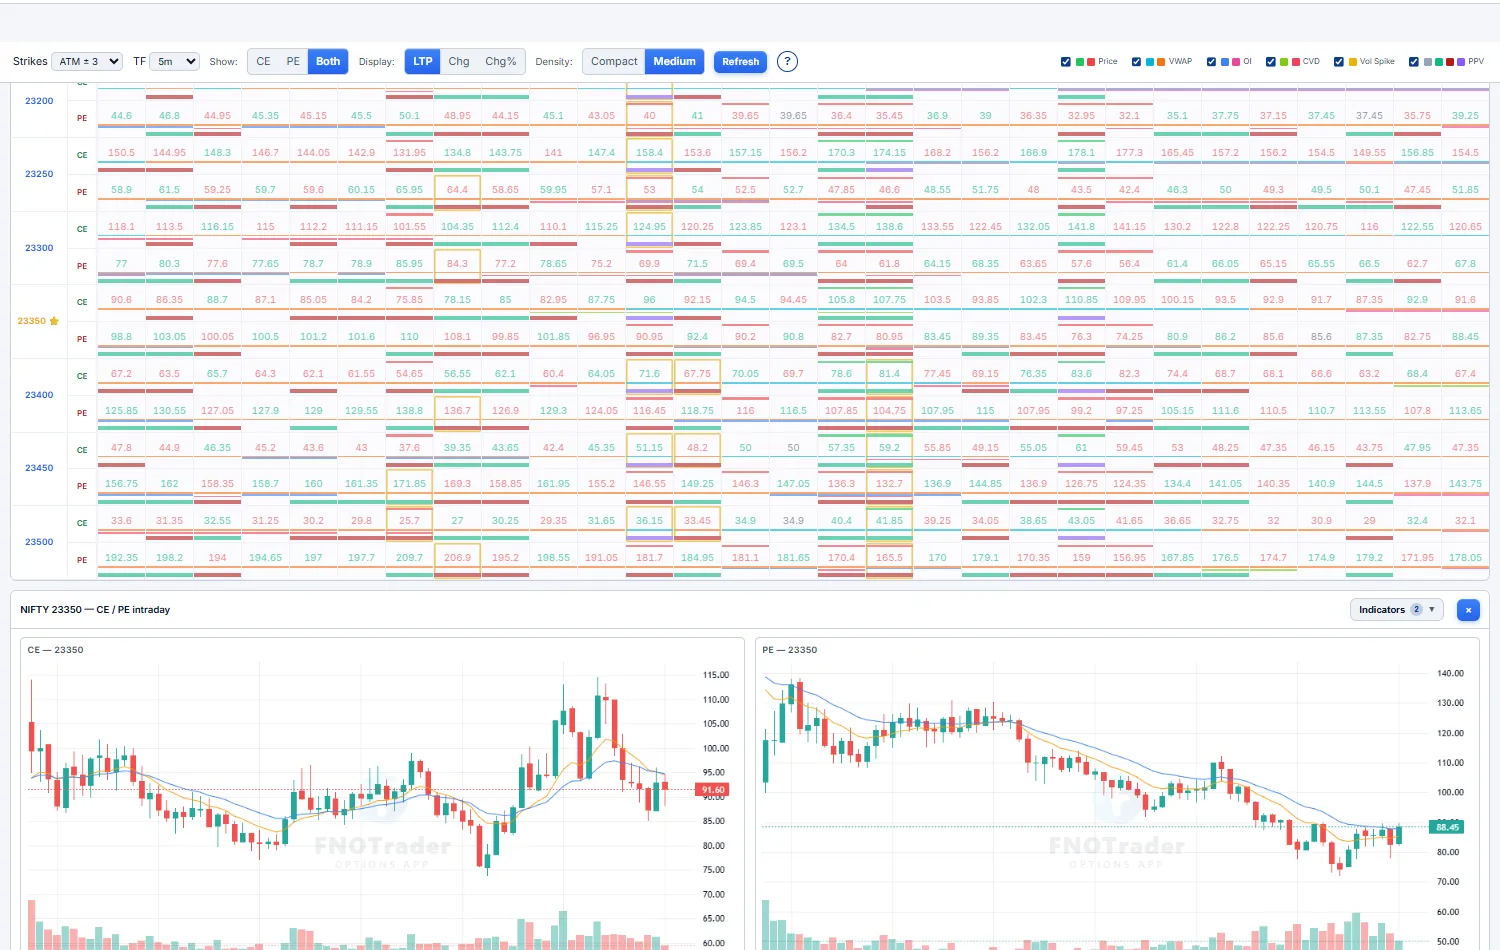
The whole option chain across the whole day, compressed into one heatmap. Strikes are rows, time buckets are columns, and each cell packs color-coded stripes — so you can scan hundreds of cells in seconds and spot the exact strike + minute where something unusual fired, without opening a single chart.
Each cell stacks up to six toggleable stripes: Price (new high/low), VWAP (above/below), OI (new OI high/low), CVD (cumulative delta — net buying vs selling), Vol Spike, and PPV (Pocket Pivot Volume — an institutional-footprint flag). A vertical band of green stripes marching across one strike's row is real, sustained buying showing up minute after minute.
- Controls —
Strikes(ATM ± N),TF1m–30m,ShowCE / PE / Both,DisplayLTP / Chg / Chg%,DensityCompact / Medium.
Options buildup
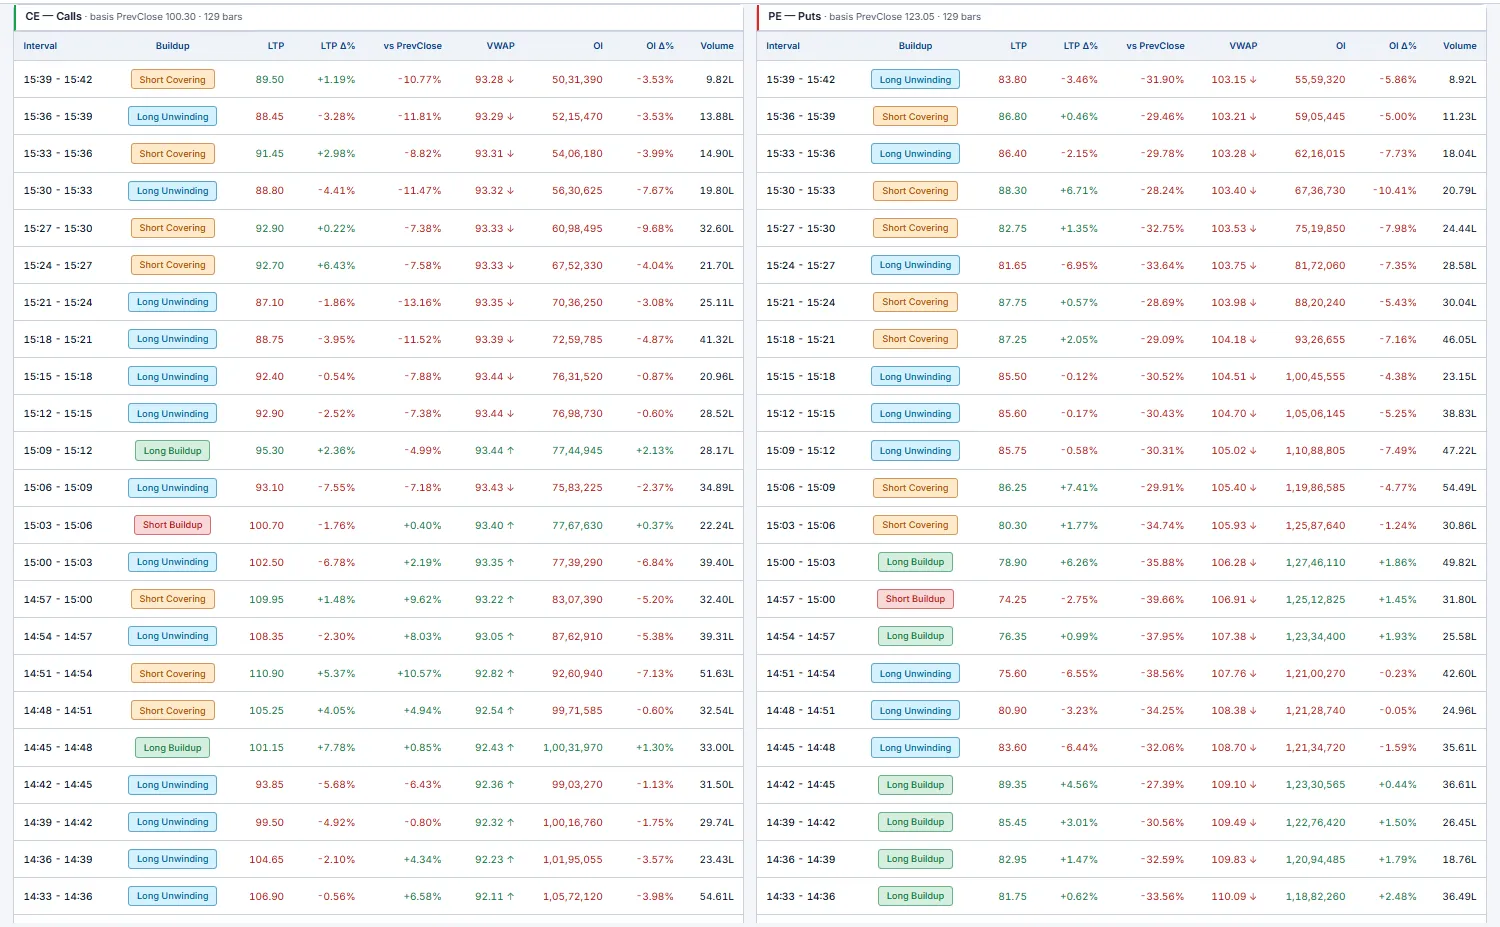
Interval-by-interval buildup classification for a single strike, CE and PE side by side. Where the OI page shows the snapshot across all strikes, this shows the story over time on the one strike you're trading — bar by bar, who's writing and who's covering.
Each row tags the bar LB / SB / LU / SC from the price-vs-OI change, alongside the LTP move, the change vs your basis, VWAP position and volume. A run of Short Buildup rows on the CE side as price drifts down is fresh call writing capping the move; flip to Short Covering and that cap is breaking.
- Controls — strike picker (ATM/ITM/OTM tagged),
Time Interval1 min – 30 min, basisvs Prev/vs DayOpen. - Columns —
Interval,Buildup,LTP,LTP Δ%,vs Prev,VWAP,OI,OI Δ%,Volume; newest bar on top.
Volatility
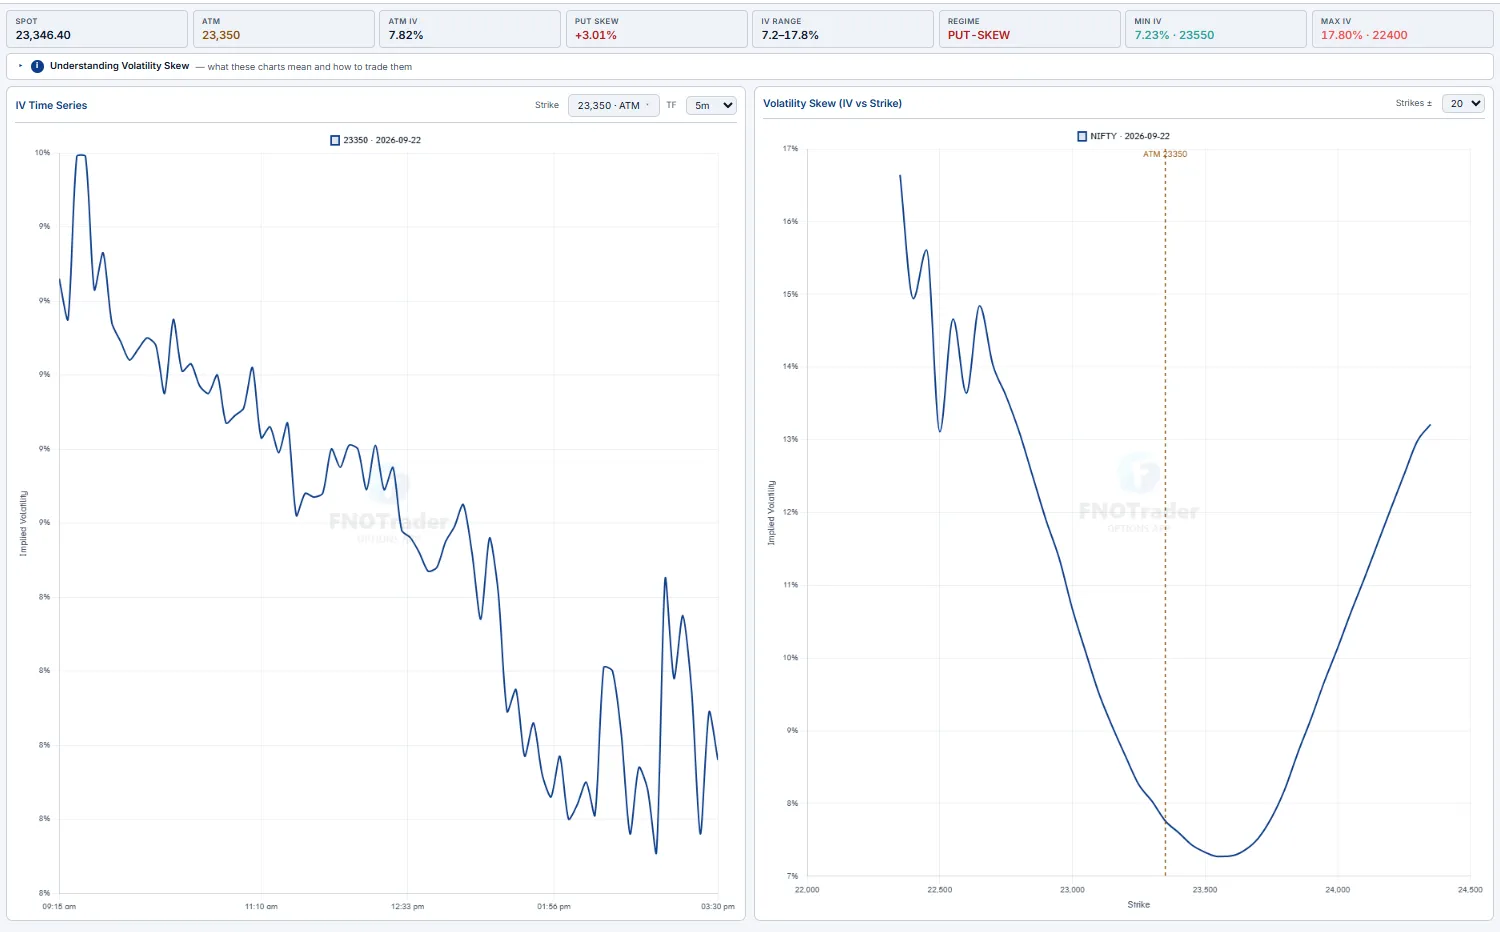
Implied-volatility analysis — the IV time-series for a strike, plus the volatility skew across strikes. Use it to judge whether options are rich or cheap right now, and where the skew tilts the edge toward buying vs selling premium.
The skew (IV vs strike) is the heart of it. A downward-sloping PUT-SKEW — OTM puts richer than OTM calls — is the NIFTY/SENSEX default: the market paying up for crash protection. A SMILE (both wings bid) signals an expected big move either way; a rare CALL-SKEW is upside speculation. The stat strip reads ATM IV, Put Skew, IV Range and the Regime tag.
F&O Movers
The day's biggest moves across the entire F&O universe, in one screen. It answers "what's actually moving right now?" without you having to scroll a chain or a watchlist. Two scopes — Futures and Options — each split into the same lenses: price gainers / losers, OI gainers / losers, top volume, and an Unusual Activity composite that blends price + OI + volume to surface names doing something out of character.
Every name carries a buildup tag read off price-vs-OI: LB long buildup (price↑ OI↑, fresh longs), SB short buildup (price↓ OI↑, fresh shorts), LU long unwinding (price↓ OI↓, longs exiting), SC short covering (price↑ OI↓, a squeeze). That one tag tells you whether a move is being built or closed — a price gainer on SC is shorts running for the door, not new conviction.
- Price gainers/losers — directional leaders, the headline movers.
- OI gainers/losers — where positioning is being added or torn down, regardless of price.
- Top volume — where the day's liquidity and attention are concentrated.
- Unusual activity — the composite flag: act here first, it catches moves before they're obvious on price alone.
A Triggered column stamps the IST time each row was first seen as a mover, so a name that just appeared with a fresh time is a new development, not stale. Auto-refreshes ~60s; use View More to page deeper into each list.
SC/LU (closing, not building).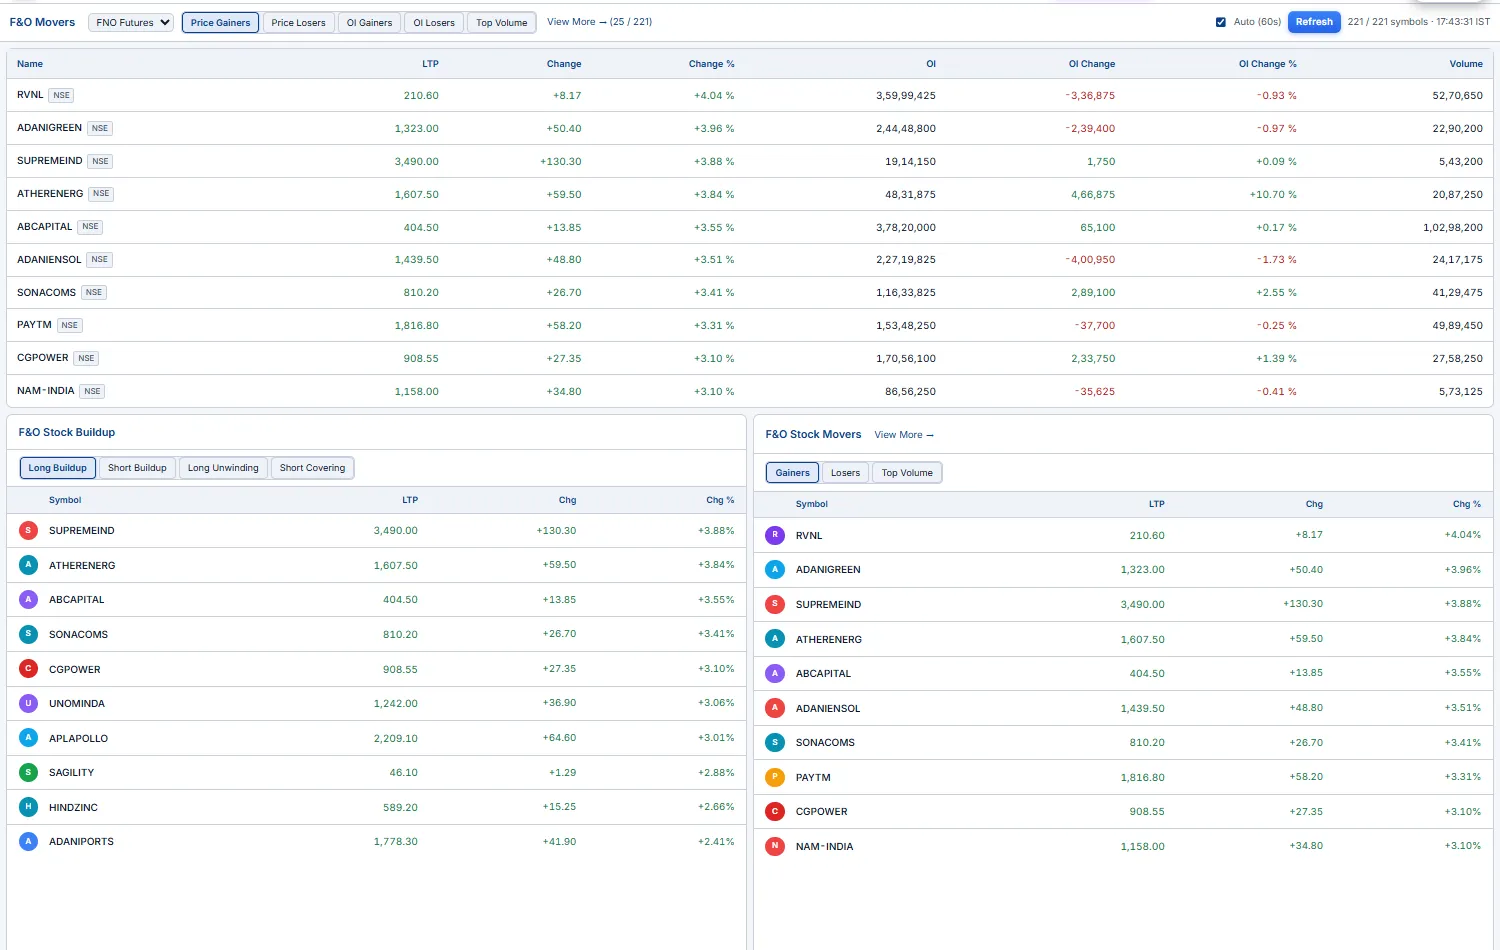
F&O Screener Intermediate Advanced
A server-side scan of the whole tradable F&O book — every index & stock, futures and options (ATM ±10 strikes) — re-run every minute and ranked into 10 buckets. Where Movers shows you the underlyings, the Screener goes contract-by-contract and layers intraday technicals on top, so you can answer questions like "show me CE contracts above their 15-min opening range, holding above EMA9, with RVOL > 1.5×."
Each row is one contract: LTP, Chg%, RVOL (today's volume ÷ 20-day average), OI / OI%, Vol, a Liq tradability badge (Liquid / OK / Thin), and a buildup tag — then the technicals: 5m/15m/30m ORB (above / within / below the opening range), CPR (above-R2 … below-S2 on the prev-day pivot ladder), EMA5 & EMA9 position, X-Day H/L (broke its N-day high/low) and Day H/L (sitting at-high / mid / at-low).
- 10 buckets —
Price Gainers/Losers,OI Gainers/Losers,Long Buildup,Short Buildup,Profit Booking,Short Covering,OI Spike,Unusual Vol,Top Volume. Pick one tab to focus a single theme. - Table vs Grid —
Tableshows one bucket with every column, sortable on any header;Gridtiles all 10 buckets as compact mini-tables for a one-glance market scan. Click a bucket header in Grid to drill into its full Table. - Filters — multi-select chips on
Type(FUT/CE/PE),Liquidity,Buildup, each ORB window,CPR,EMA5/9,X-Day,Intraday H/L, plus min/max number filters onLTP / Chg% / RVOL / OI / OI% / Voland asectordropdown. Filters AND together — stack them to build a precise setup. - Symbol search (e.g.
TIMKEN) overrides the buckets and returns that underlying's fullFUT + CE + PEchain in one view. - Click any contract → a chart popup (real OHLC, 5-min). Your view (bucket, filters, sort, search) survives an F5.
Type:CE + 15m ORB:above + EMA9:above + RVOL ≥ 1.5 + Liquidity:tradable — and let the 1-minute refresh feed you fresh candidates all session, instead of eyeballing chains.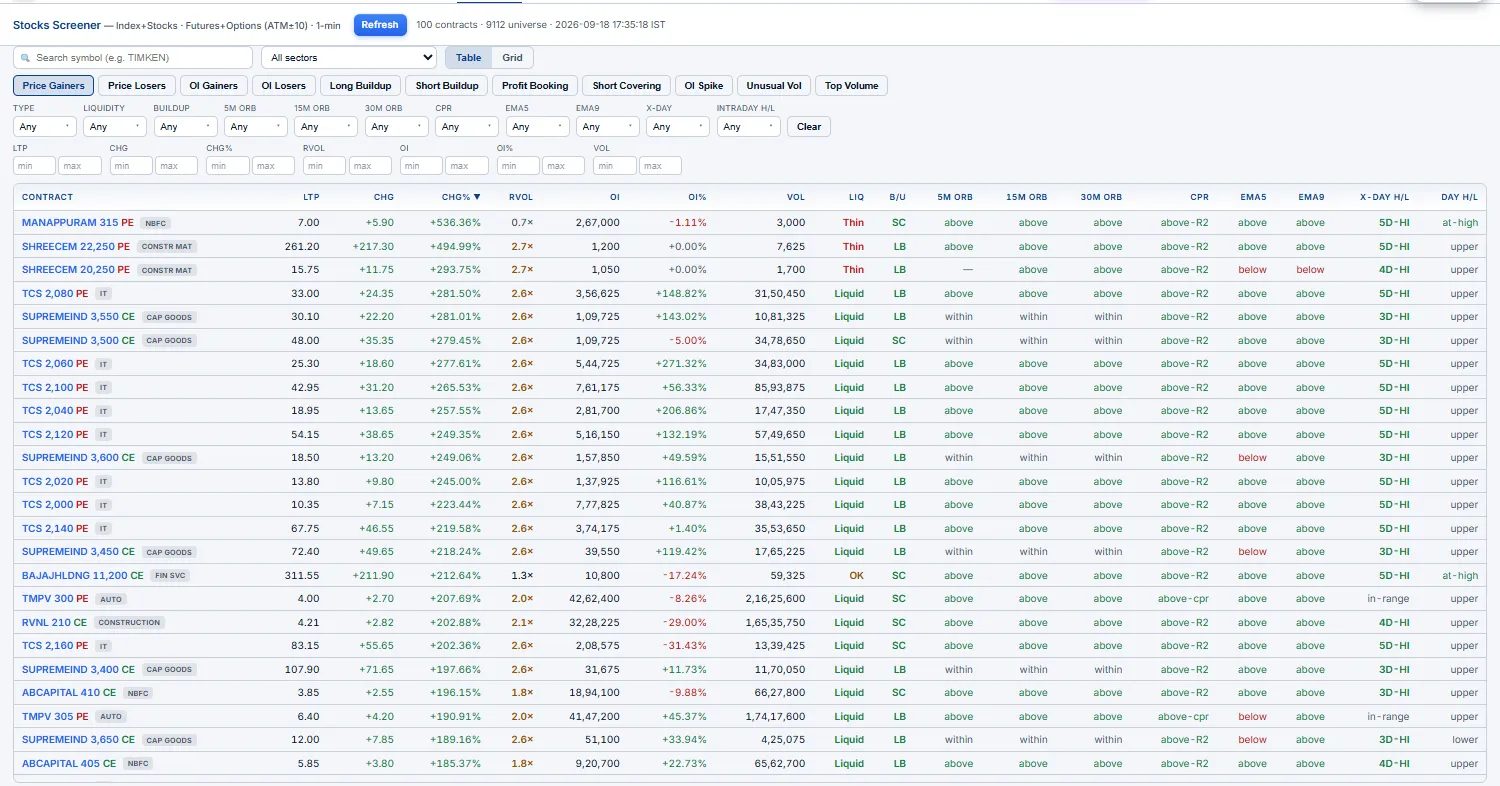
Setups Intermediate Advanced
Algorithmic intraday trade setups detected on 5-minute bars — fully specified, with entry, targets, stop and a same-day outcome. The engine flags long candidates from confluence (new intraday high + a volume spike + price above VWAP) and short candidates from the mirror (range-bound + opposite-side strength), so you don't have to watch 200 charts to catch a clean break.
Each card hands you a complete plan: an Entry level, T1 / T2 targets and a Stop-loss, plus the same-day backtested result — T1 HIT, SL HIT or OPEN — so you can see at a glance how the day's setups are actually resolving. Refreshes about every 15 minutes.
Stop-loss is the mechanical one. Education-only — mechanical pattern flags, not buy/sell calls.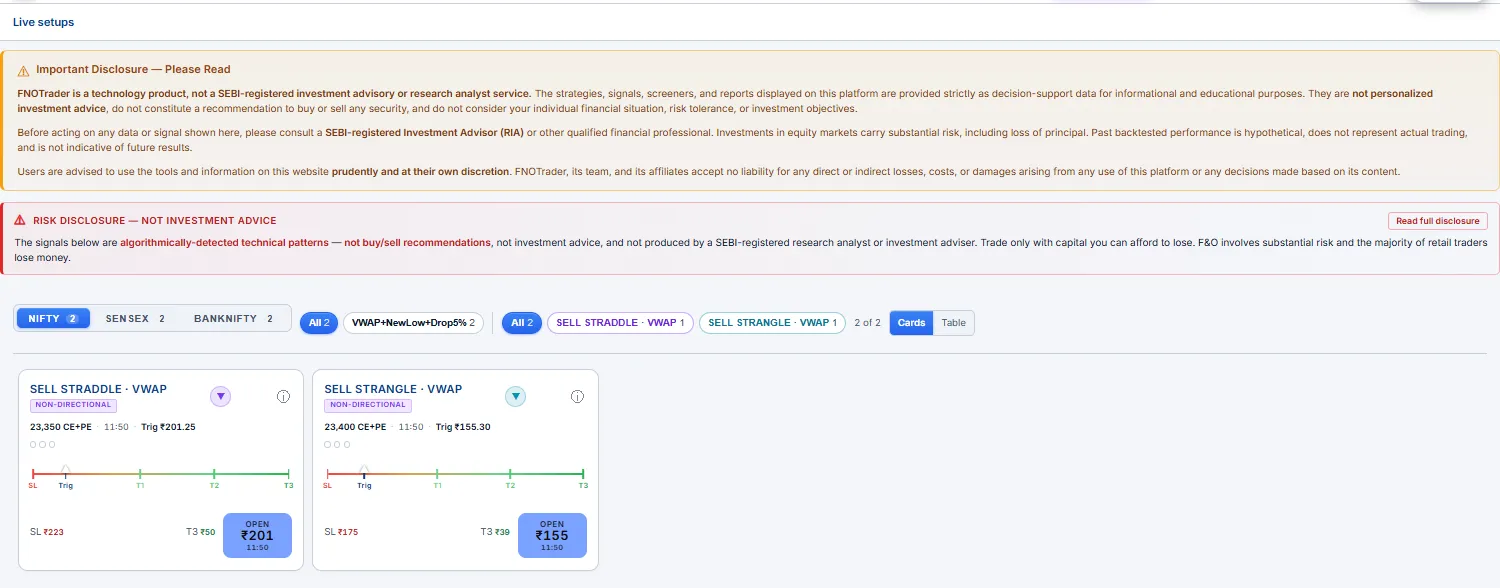
Option Multibaggers ⚡ Beginner Intermediate
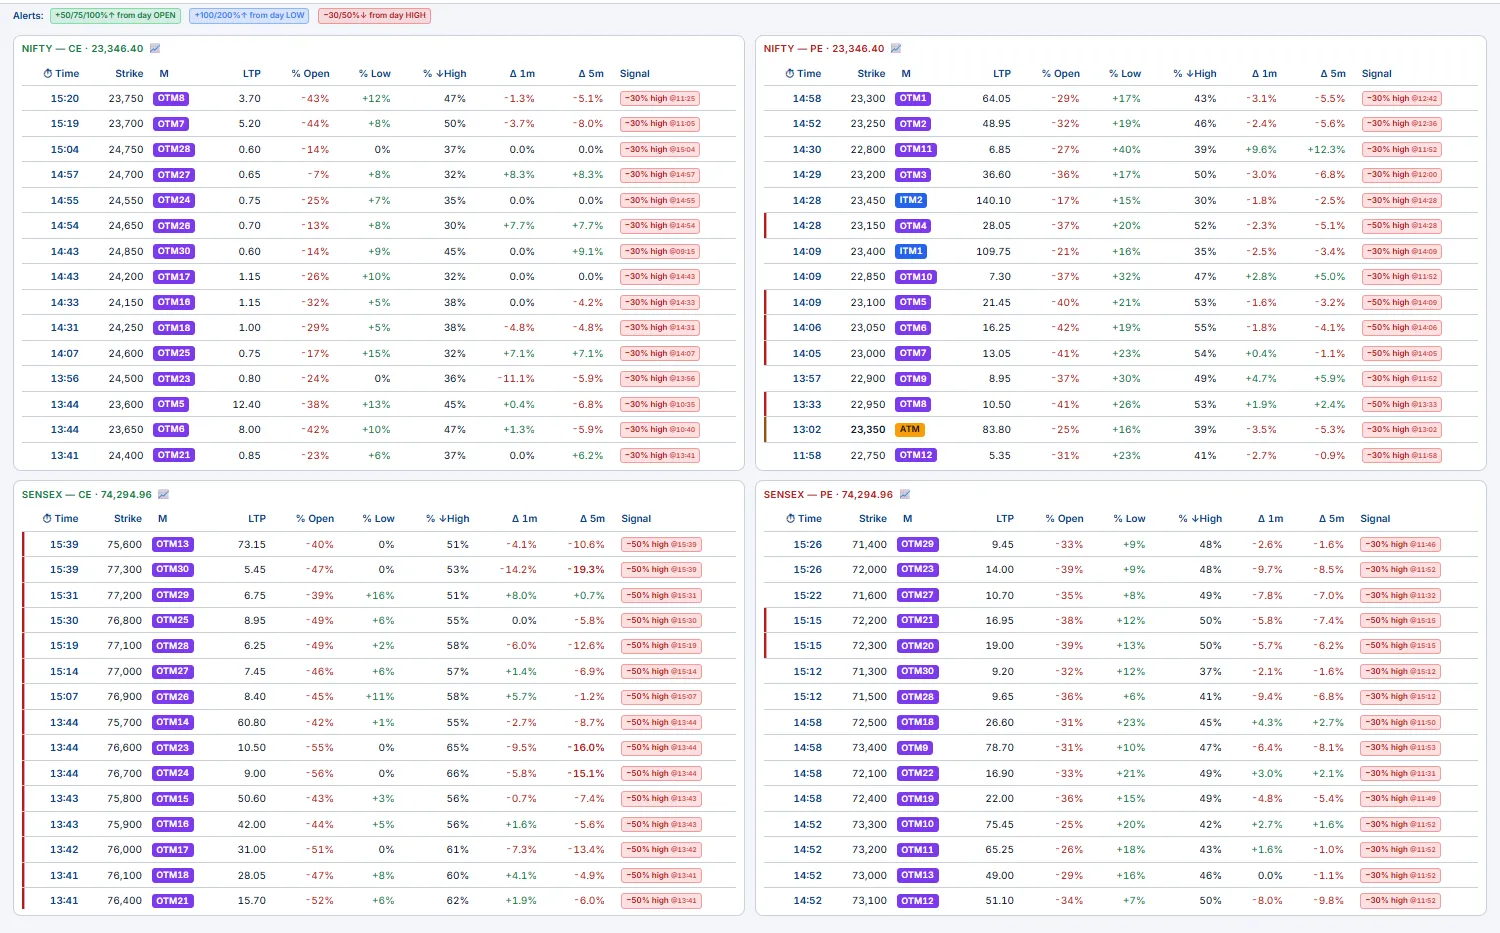
A live scanner of every NIFTY & SENSEX weekly strike (ATM + the OTM wing, ITM to 10) in four tables — NIFTY-CE, NIFTY-PE, SENSEX-CE, SENSEX-PE — ranked to surface options making big, fast intraday moves (the kind that run 20 → 120 in an afternoon). The largest % moves happen in cheap OTM options that are invisible on a normally-sorted chain; this page watches all of them at once and timestamps the exact minute each one started running, so you act early instead of chasing the top.
Reading the columns
- ⏱ Time — the session minute the move fired (when the strike first crossed its alert tier), read off 1-minute bars. Rows sort latest-first, so fresh movers stay on top.
- Strike / M — the strike and its moneyness (ATM / OTMn / ITMn). OTM is the cheap, high-leverage wing where multibaggers live.
- % Open / % Low / % ↓High — move from the day's open, up from the low, and drawdown from the high. % Low catches a strike that bottomed and is ripping; % ↓High flags one already fading.
- Δ 1m / Δ 5m — momentum over the last 1 / 5 minutes; the 1m / 5m toggle chooses which drives the highlight (1m = fastest triggers, 5m = less noise).
- Signal — labeled tiers with their fire-time:
+50/75/100% open,+100/200% low,−30/50% high. Strongest gainer gets a green left-edge, biggest fader a red one.
Turn on Sound for a beep on each new tier crossing; rest your cursor on a row for ~2s to pop its mini-chart. ⚠️ Education only — a big % on a ₹2 option is still a ₹2 option; size for the premium, not the percentage. Deep-ITM / illiquid strikes are auto-filtered.
Stocks Beginner Intermediate
A sortable scanner across every F&O underlying (~200 names) — your "what's moving today" dashboard for the cash side. One row per stock, ranked on whichever lens you care about, so you can rotate from "biggest movers" to "unusual volume" to "where positioning shifted" without leaving the page.
- Price Δ% — the biggest movers today, up or down.
- Vol Δ% vs avg / RVOL — unusual volume; a stock trading well above its average is where attention is.
- OI Δ% — sudden positioning shifts in the future, often ahead of the price move.
- Futures basis — front-month premium/discount to spot. A large basis frequently flags heavy directional positioning.
- Sector / index-member filters — narrow to NIFTY 50, BANKNIFTY components, a single sector, etc., to see whether a move is name-specific or sector-wide.
Vol Δ% first thing to find the day's unusual-activity names, then check each one's OI Δ% and basis — high volume + rising OI + premium basis is a stock being actively positioned long, a cleaner read than price change alone.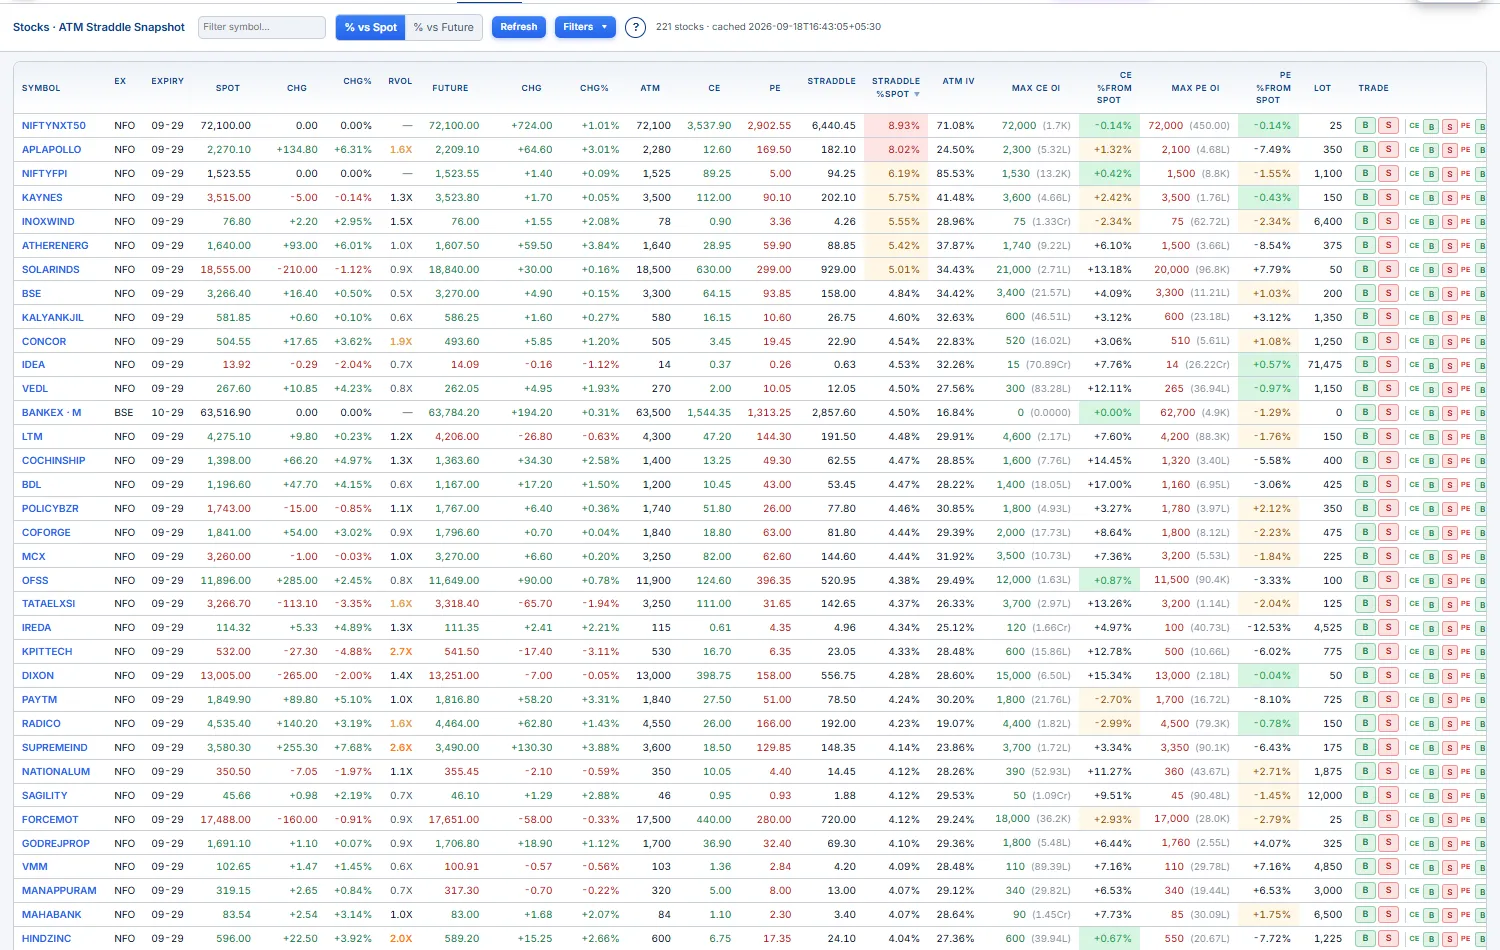
Sectors & Constituents Beginner Intermediate
A three-column rotation hub: every NSE sectoral index on the left, the selected sector's member stocks in the middle, and a full charting canvas on the right — all linked and updating live. It collapses "which sector is leading, which stock inside it is doing the work, what does its chart look like" into a couple of clicks.
- Sectoral Indices (col 1) — all 17 indices with
LTP,Chg,Chg%, sortable headers. Click one to drive the middle column. - Constituents (col 2) — that sector's index plus its member stocks, each with
LTP,Chg,Chg%andRVOL(relative volume). Sort byChg%to find the leaders or byRVOLto find where the volume is. The index row sits pinned at the top so you can compare a stock against its own sector. - Chart (col 3) — the full TradingView Advanced chart for the clicked symbol: drawing tools, 100+ indicators, every resolution/range, IST time axis, live ticks.
The index and stock tables both tick in real time, so leadership shifts as the session moves — no refresh needed.
Chg% to find the day's strongest sector, click it, sort its constituents by RVOL to find the stock actually being bought, then read its chart on the right — all without typing a symbol.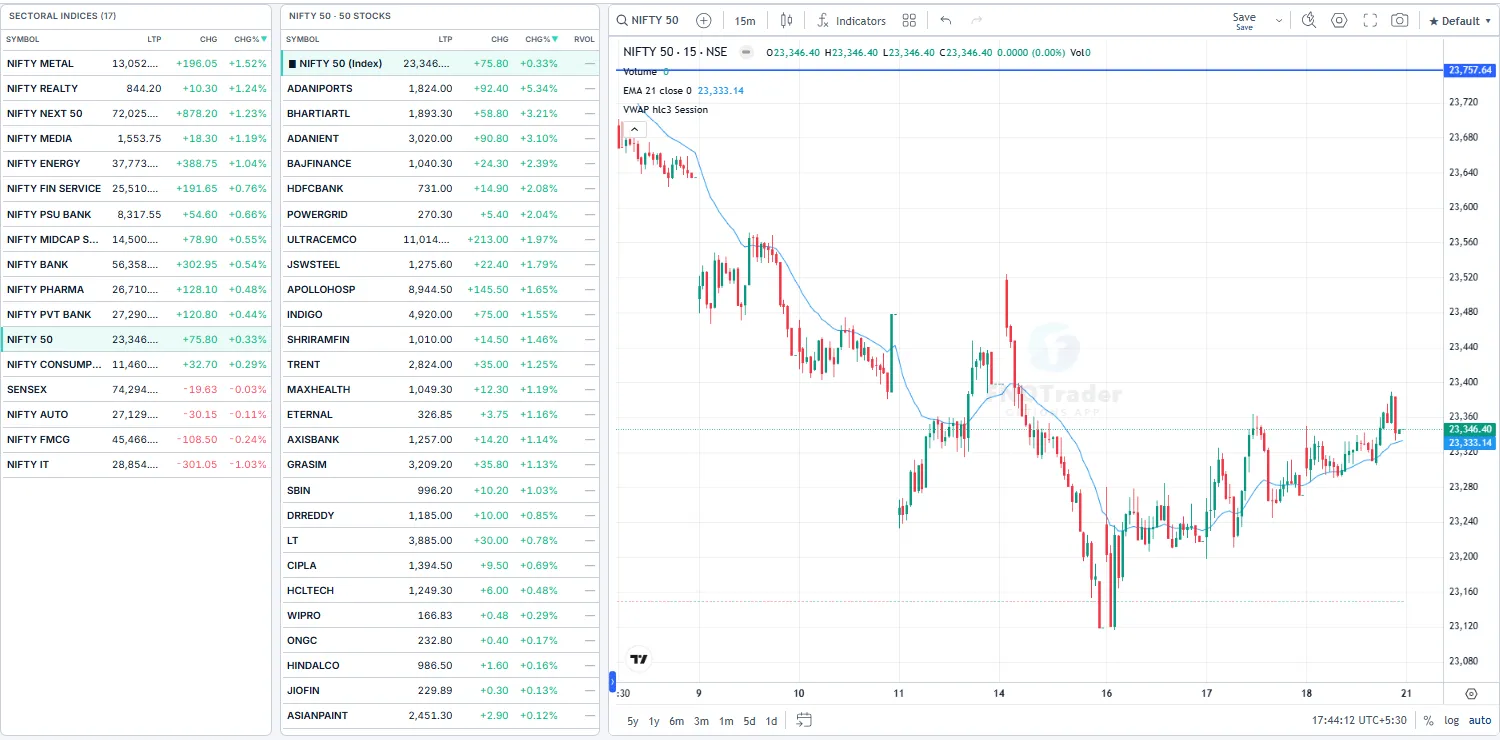
Breadth Intermediate
The market's internals in one screen — is the move broad or narrow? Breadth bundles four reads of participation so you can tell whether an index move has the whole market behind it or is being carried by a handful of heavyweights.
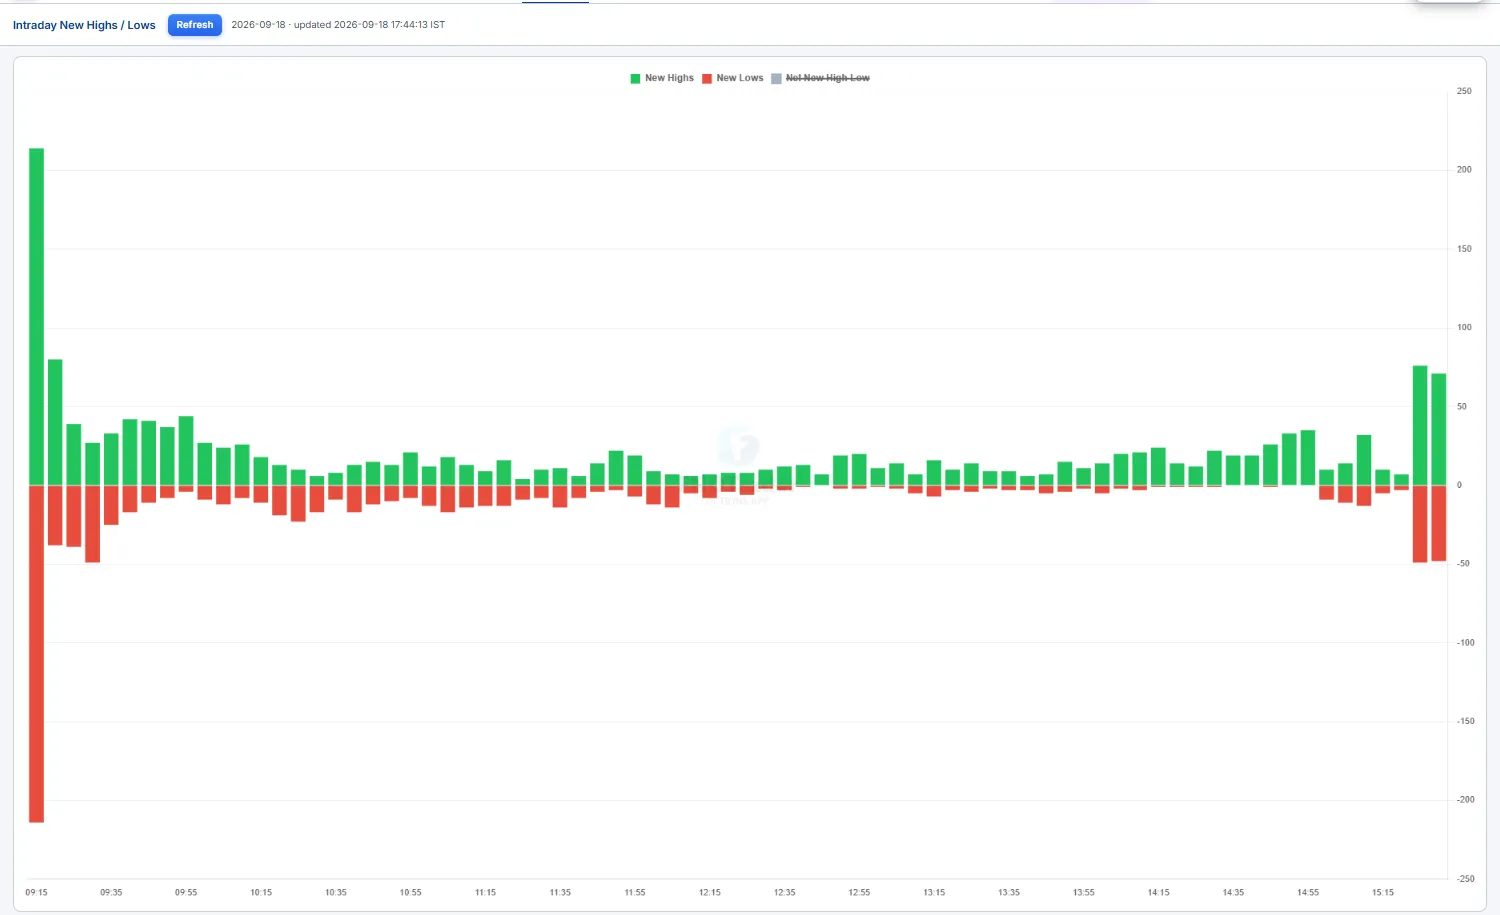
- At Day High / At Day Low / Net — a live time-series of how many F&O stocks are printing intraday highs vs lows, and the net. Rising
Net= strength spreading; a flat index with collapsingNetis a warning the move is thinning out. - At-extreme list — the names currently sitting at their day high or day low, right now.
- Breakout screener — stocks breaking a 5-day high/low out of a tight consolidation, the cleaner momentum candidates.
- Opening-Range (ORB) tracker — who's holding above / below their opening range, with a
5m / 15mwindow toggle.
Net for conviction: a rallying index on strong, rising Net at-highs is broad and trustworthy; a green index on negative Net is being faked higher by index weights — fade-the-strength territory.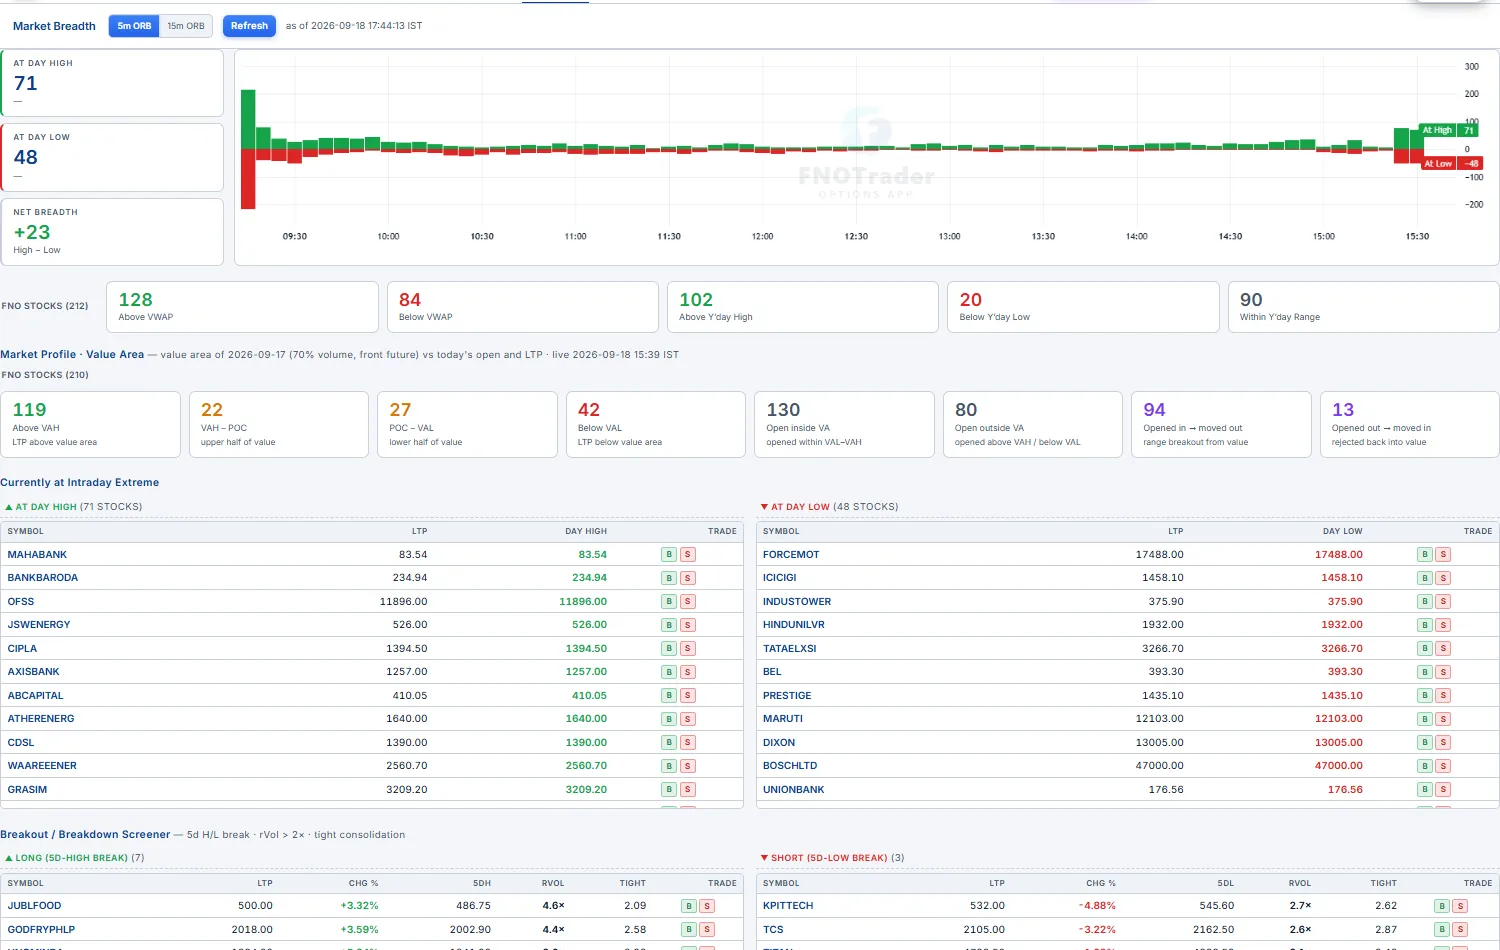
Advance / Decline Beginner
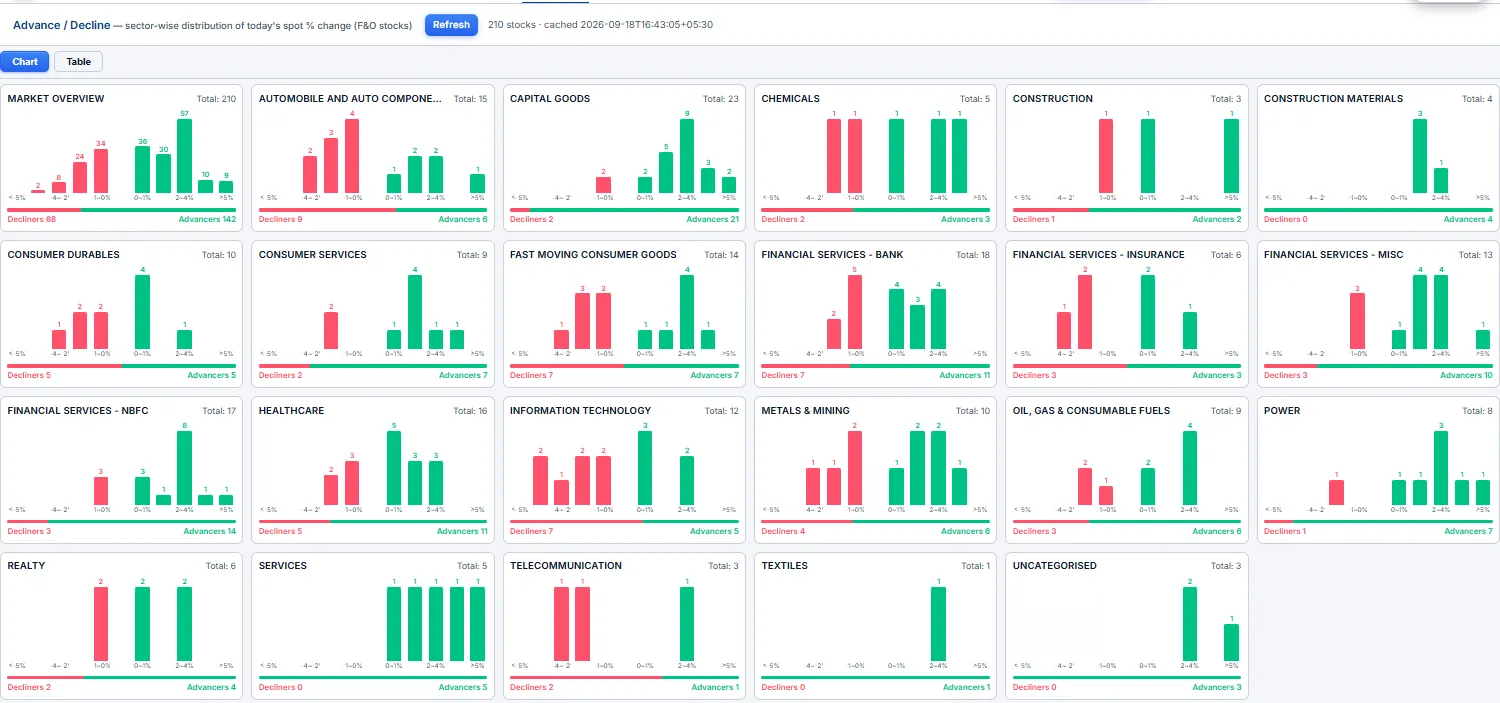
Sector-wise advance/decline of the F&O universe — how many stocks are up vs down inside each sector. The fastest read of which sectors are carrying the market and which are dragging, without looking at a single chart.
Each sector shows its advancers (green) against decliners (red) as a split bar; a sector that's almost all green is genuine leadership, a near-even split is churn, and an all-red sector is where the weakness is concentrated. Use it at the open to see where the day's bias actually sits, and through the day to spot rotation as bars flip from one side to the other.
High / Low Bars Beginner
The simplest breadth-extremes reference: a two-column live list of stocks currently at their day high vs their day low. One side is everything printing fresh intraday highs, the other everything at fresh lows — sortable by count so you can see at a glance which side is heavier.
It's the no-frills version of the breadth read: a tall green column over a short red one means strength is broad right now; a balanced pair means the tape is mixed. Glance at it to confirm an index move has names behind it before you trust a breakout.
High / Low Heatmap Intermediate
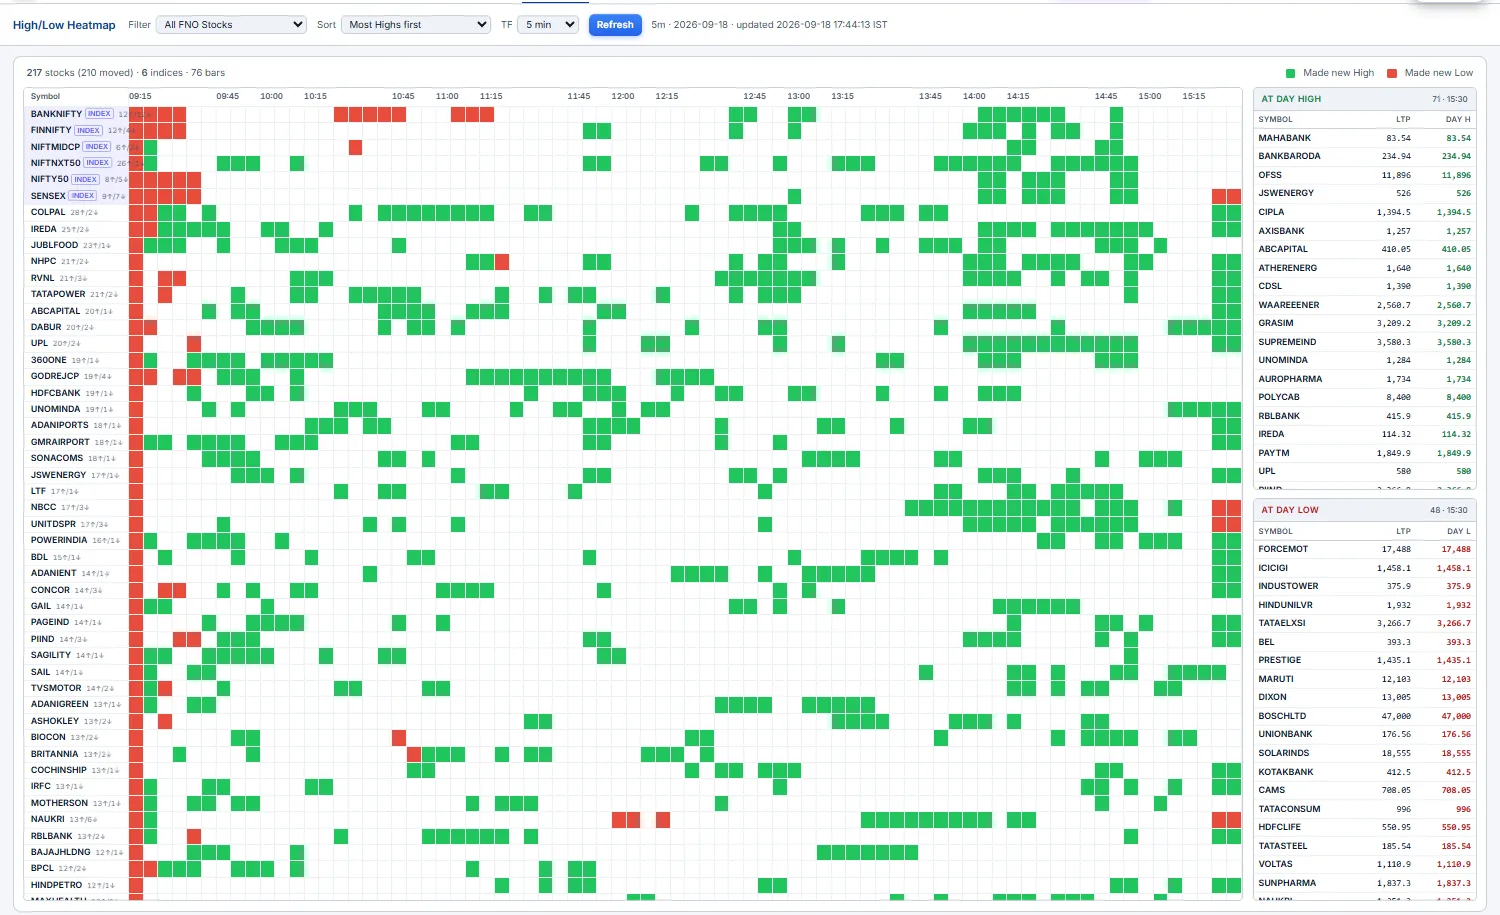
A stocks × 5-minute grid that shows you when strength and weakness clustered through the session. Each cell turns green when the stock printed an intraday high in that 5-minute bar and red when it printed a low — so a row reading left-to-right is one stock's day, and a column is the whole market at one moment.
- A green column — many stocks made highs in the same bar: a coordinated, broad push (often after a breakout or a news pop).
- A green row that fades to grey — a stock that led early and stalled.
- Filter to all F&O or a single index, choose
highs-only/lows-only/both, and sort by most highs, most lows, or net bias.
Sector Change Beginner
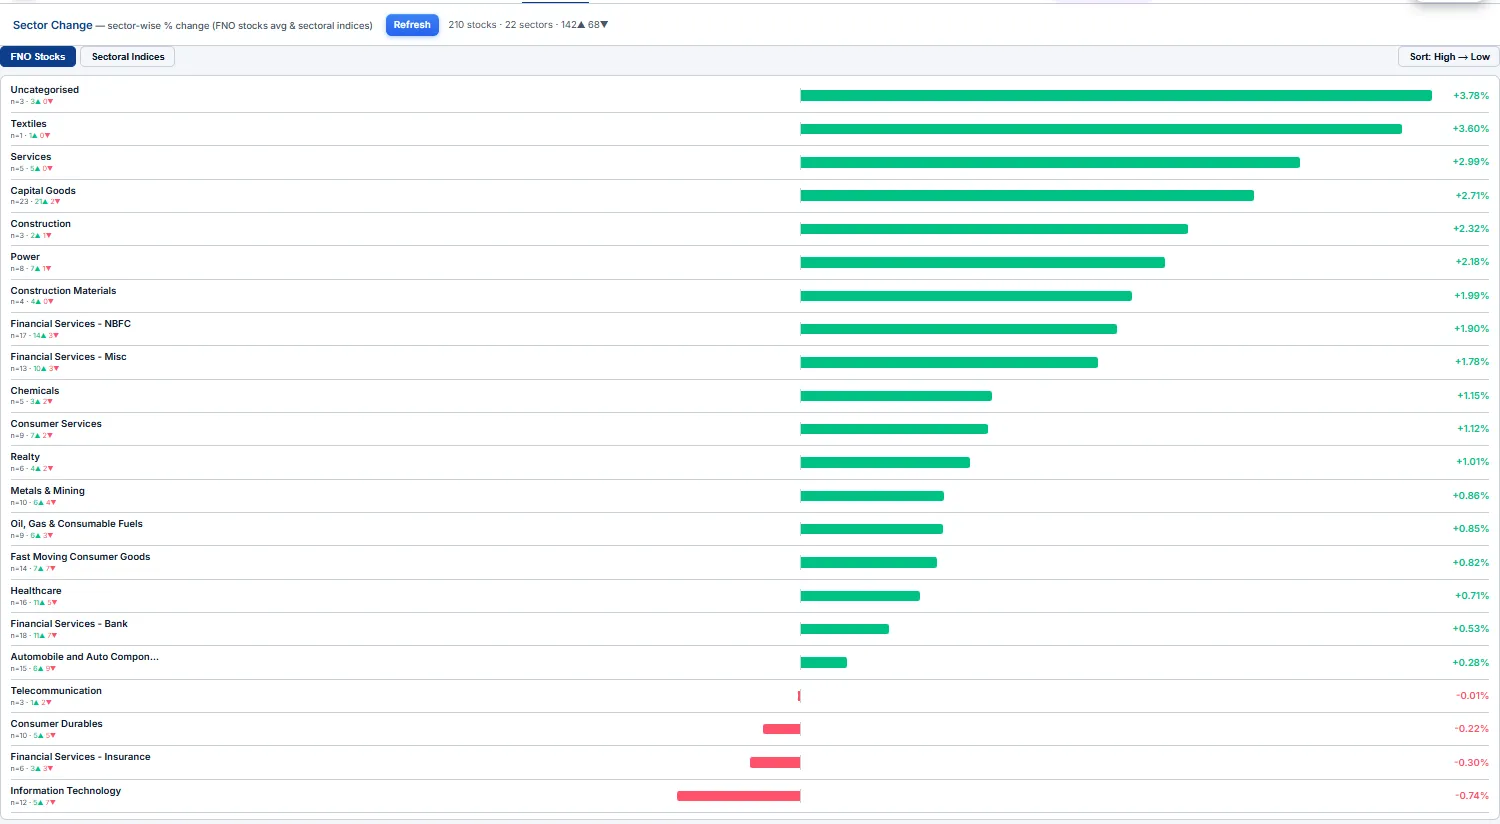
The quickest sector-rotation snapshot: the average % change of F&O stocks grouped by sector, shown next to each NSE sectoral index's own % change. The two columns side-by-side let you spot divergences — when the average member is up more than the index, the move is broad inside the sector; when the index leads its members, a couple of heavyweights are doing the lifting.
Colour-coded green/red, sortable, with a last-updated timestamp. Sort descending to see today's leaders at the top and the laggards at the bottom — the fastest "where's the money rotating?" read in the app.
Dashboard
A board you build yourself out of live widgets. Click + Widgets to drop in any of ~30 panels — Price Chart, Option Chain, Chain Metrics (Spot / PCR / Max Pain / ATM IV), CE / PE Σ Greeks, OI Metrics, Cumulative OI, Straddle / Strangle tables, IV Chart, the GEX / DEX / TEX / VEX exposure family, Market Breadth, Sector Change and more. Drag a widget's header to move it, drag its edges to resize.
Every board carries its own symbol + expiry from the top bar, so all widgets on it update together — switch the symbol once and the whole screen re-points. Keep several saved boards (one for indices, one for stocks, one for an event-day setup) and flip between them.
Chain Metrics — Top across the top, then CE / PE Σ Greeks, OI Metrics and a Price Chart below — one glance gives you spot, PCR, max-pain, the OI walls and the net greeks before the bell.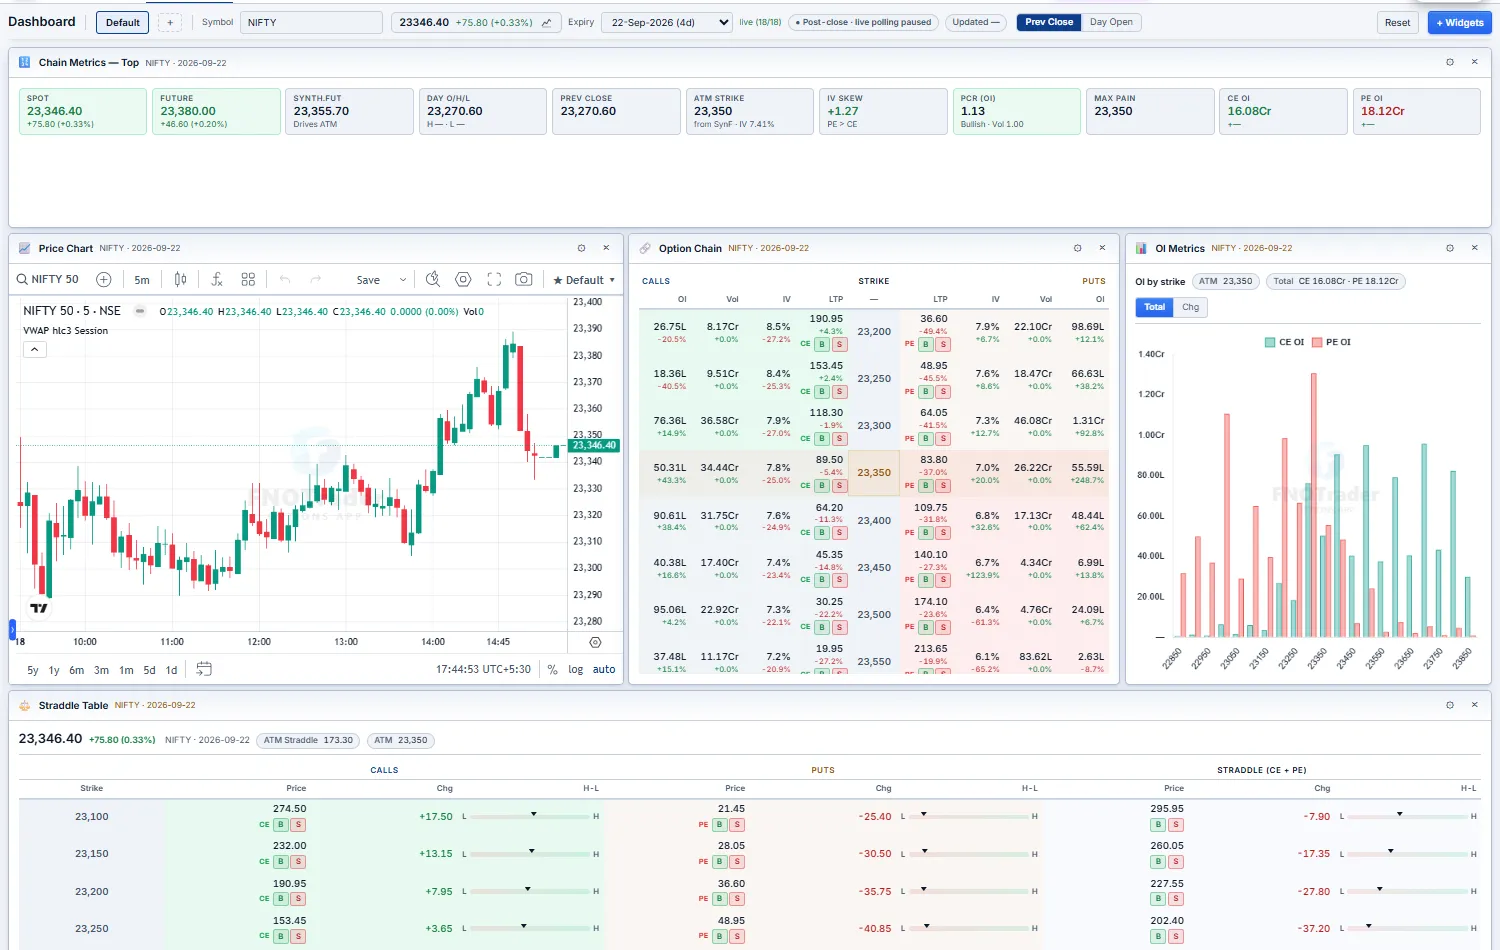
MarketWatch
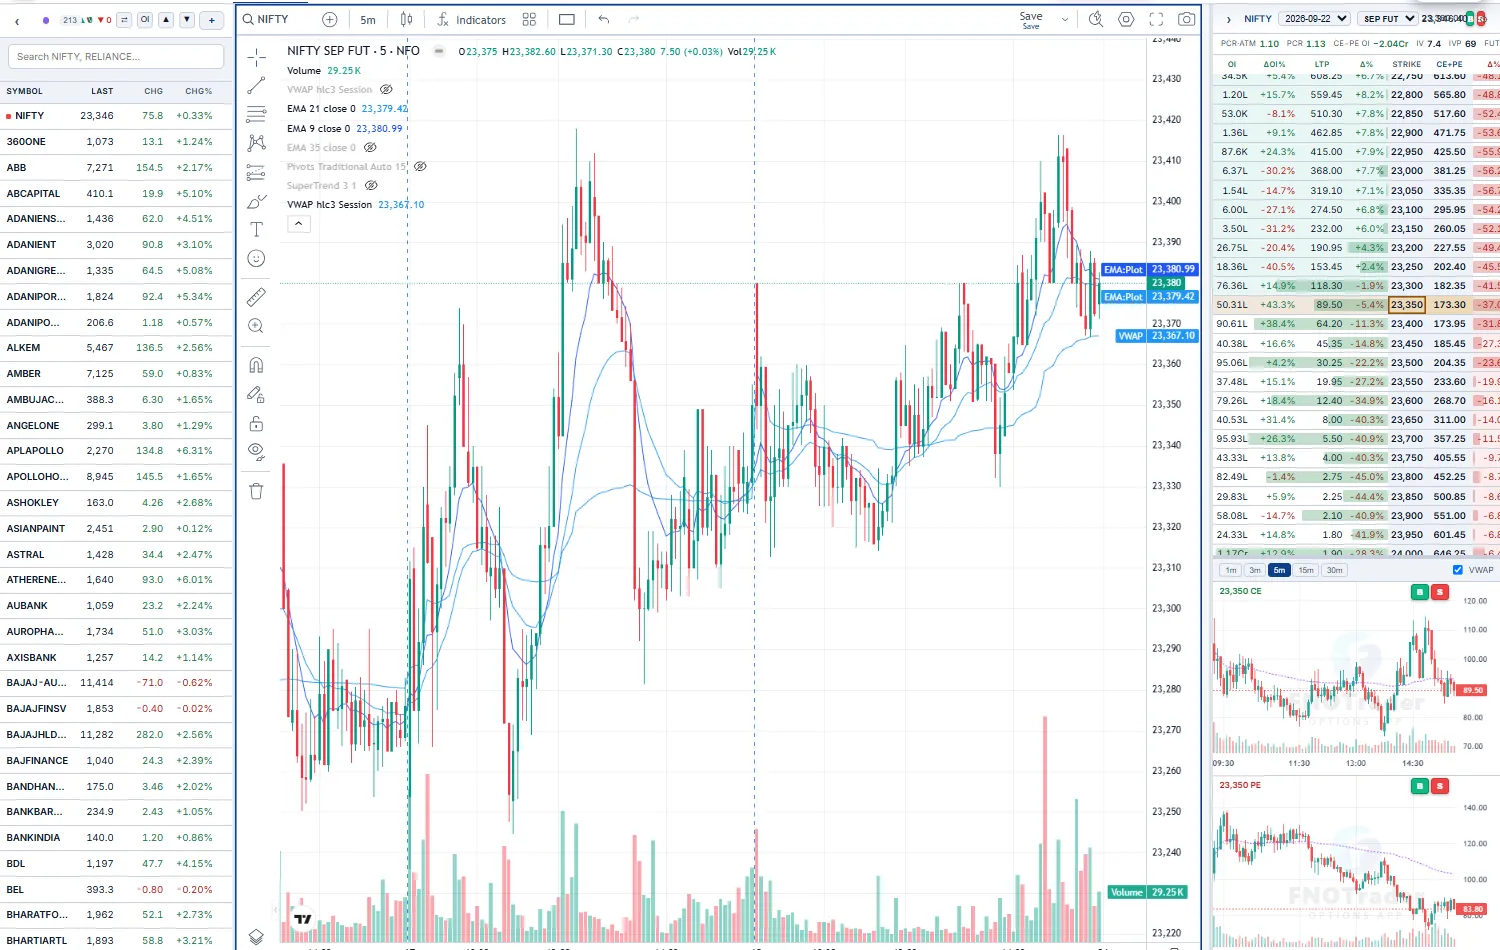
The licensed TradingView charting library wired to FNOTrader's F&O data. Multi-pane layouts (1–4 charts), the full drawing toolset, indicator templates, and custom studies built for options traders — FT – Open Interest, Pocket Pivot and Mansfield RS.
- A drag-resizable watchlist sidebar (including the auto-built
F&O Stockslist) shows live LTP / CHG — click a symbol to chart it, or step through with the▲/▼buttons. - A docked Option Chain panel on the right tracks whatever you're charting: a compact ATM-highlighted CE/PE chain with
ΔOI%andΔ%columns. - Pick a strike in that chain and its CE/PE candle charts render below — TF selector, IST time axis, VWAP and volume — so you can flip from the underlying to the actual option contract without leaving the page.
Resize the panel, and the chain↔candles split, to taste — your layout persists.
Events
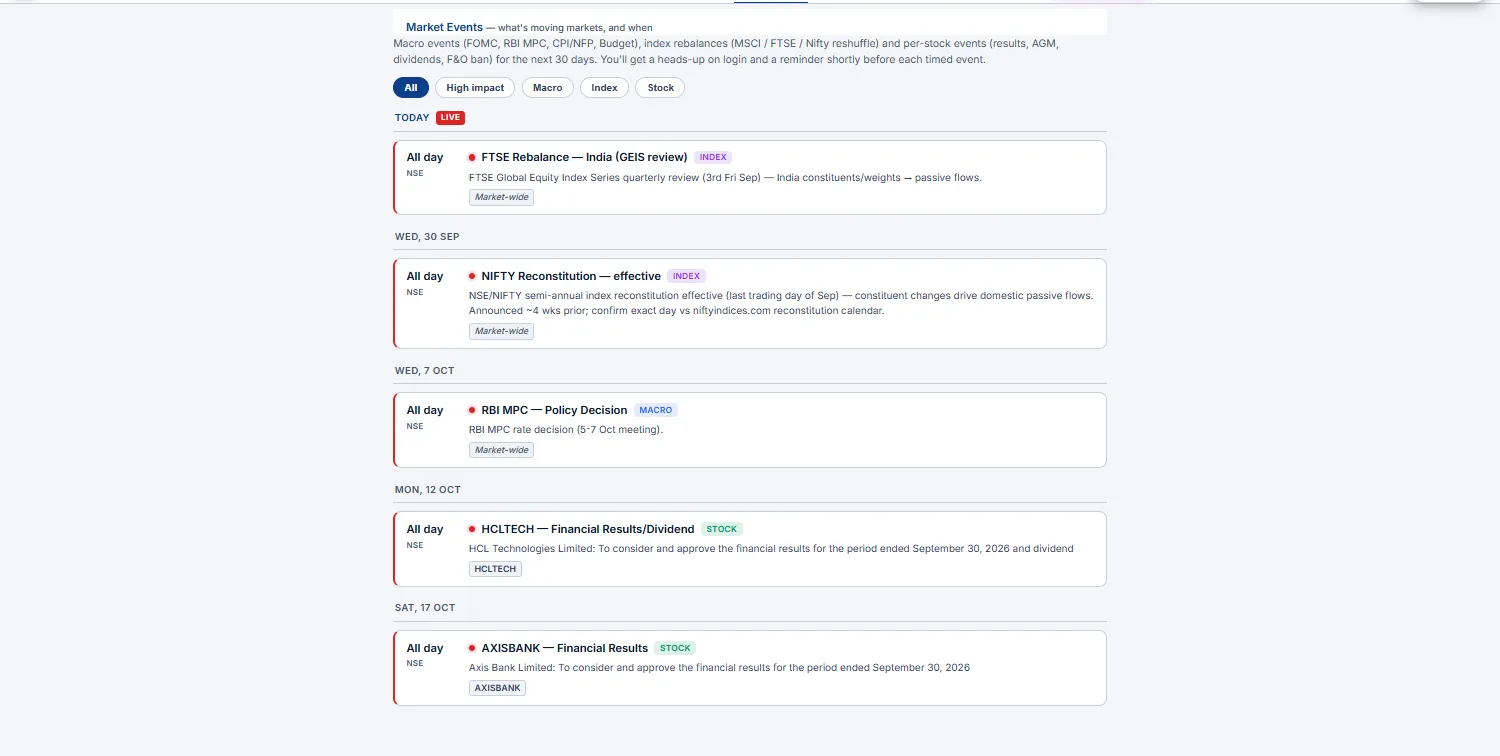
A calendar of things that move markets — so a position is never caught off-guard. The Events page lists upcoming events grouped by day (today first), pulled from the shared market-events feed: macro (FOMC, RBI MPC, CPI/NFP, Budget), index rebalances (MSCI / FTSE / Nifty reshuffle), and per-stock corporate actions (results, AGM, dividend, split, F&O ban).
Each card carries an impact dot (High / Medium / Low), a category chip (Macro / Index / Stock / Corp Action), the IST time (or All day), and the symbols affected. Filter the page by All, High impact, or category.
Two things find you even when you're not on the page:
- A login banner (once per IST day) summarising today's events — e.g. "3 market events today — 19:30 FOMC decision…" with a
View alljump. - A T-minus toast that fires a configurable lead (default 15 min) before each timed event, and immediately if you log in inside that lead window — so a rate decision or a results print announces itself while you still have time to flatten or hedge.
Cash market activity
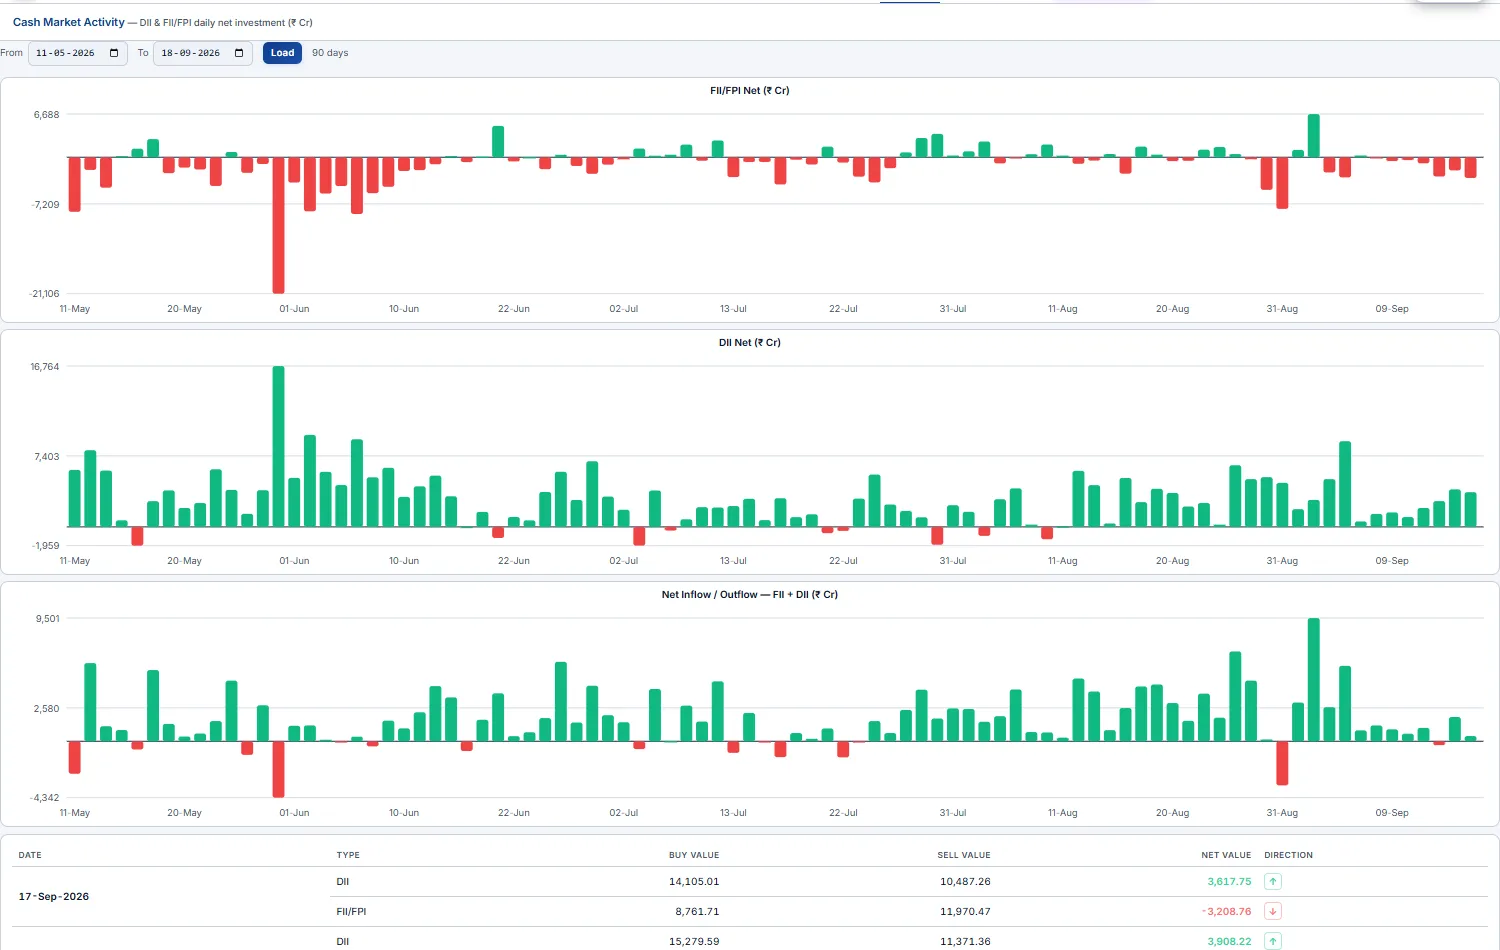
Who's actually buying and selling Indian equities each day. The page shows daily net FII/FPI (foreign portfolio investors) and DII (domestic institutions) activity in the cash segment, in ₹ Cr — green/red bar charts (FII net, DII net, combined net) over a date range you pick, plus a day-wise table.
The table breaks each day into Buy Value, Sell Value and Net = Buy − Sell per category, with a direction arrow. Read FII vs DII relative to each other: foreign selling absorbed by domestic buying is a very different tape from both sides hitting the bid together.
FII index activity
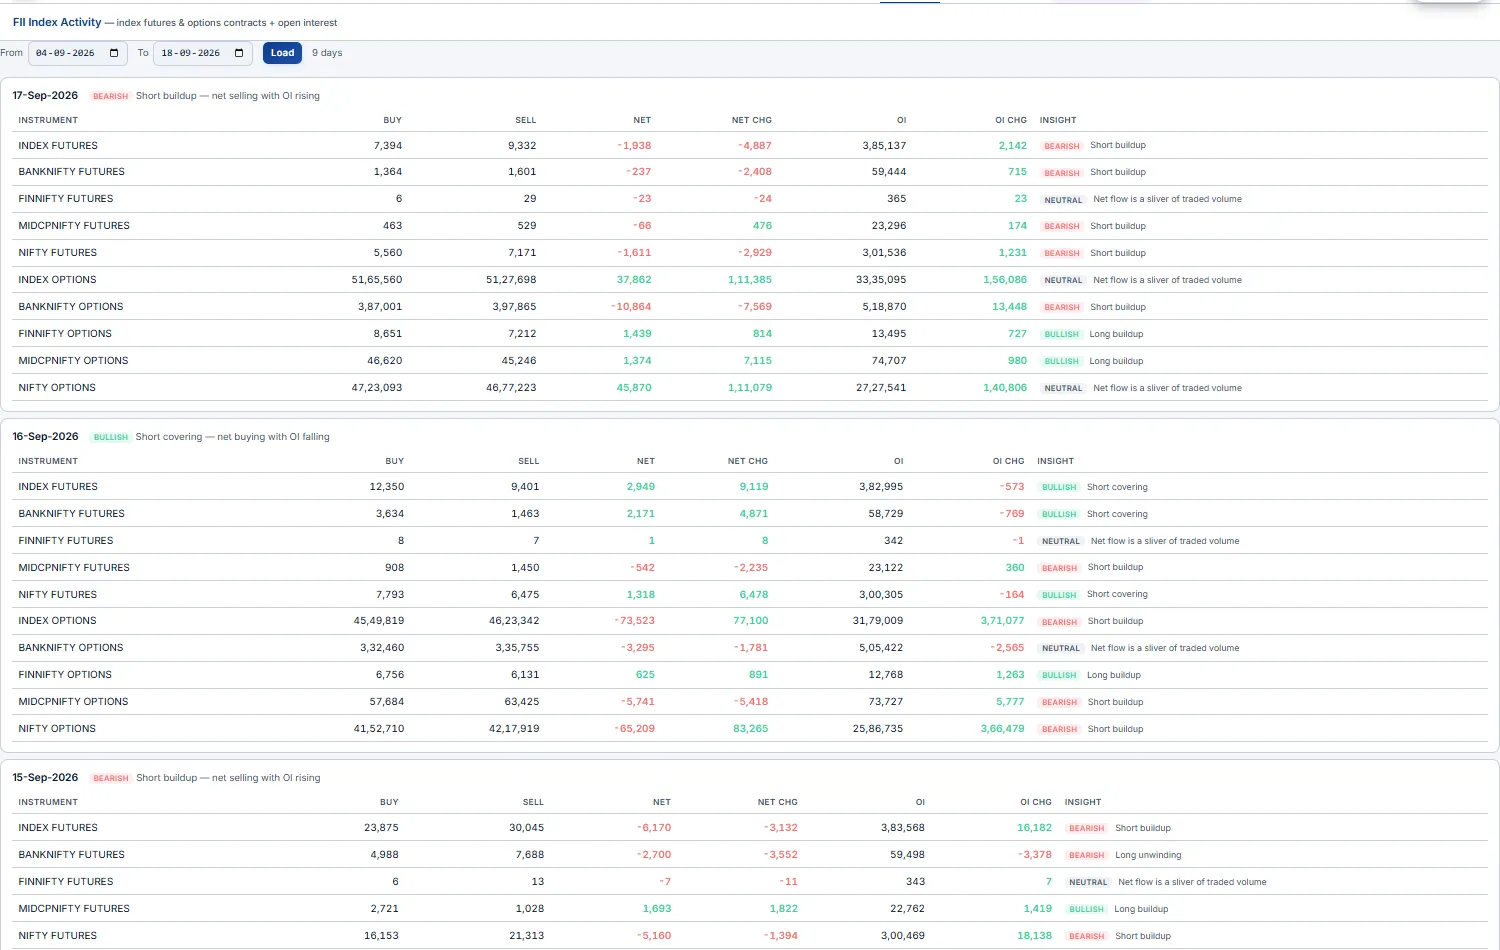
The foreign-investor stance in index derivatives, expiry by expiry. For each trading day the page lists FII positioning across Index Futures, Index Call (CE) Options and Index Put (PE) Options — contracts bought, sold, net, net change, open interest and OI change.
The value-add is the per-row Insight chip: the engine reads net-flow sign against OI change and labels the classic participant pattern — net buy + OI up = long buildup (bullish), net buy + OI down = short covering, net sell + OI up = short buildup (bearish), net sell + OI down = long unwinding. A neutral flag suppresses noise when the net is a sliver of traded volume.
Participant open interest
Who is positioned which way — split by participant type. NSE publishes daily F&O open interest broken into Client (retail / HNI), DII, FII and Pro (proprietary desks). This page shows the day-over-day change in each group's net index position across futures, index CE and index PE — with a Bullish / Bearish stance chip per cell.
The chips encode the directional read: net-bought futures or calls = bullish; net-bought puts = bearish. Reading the four rows together tells you whether the move is being driven by smart money (FII/Pro) or by the crowd (Client) — and when those two diverge, you're seeing positioning that often resolves in the institutions' favour.
FII and Pro lean one way on index futures while Client leans the opposite, weight your bias toward the institutions. Use it as a positional-stance overlay, not an intraday trigger.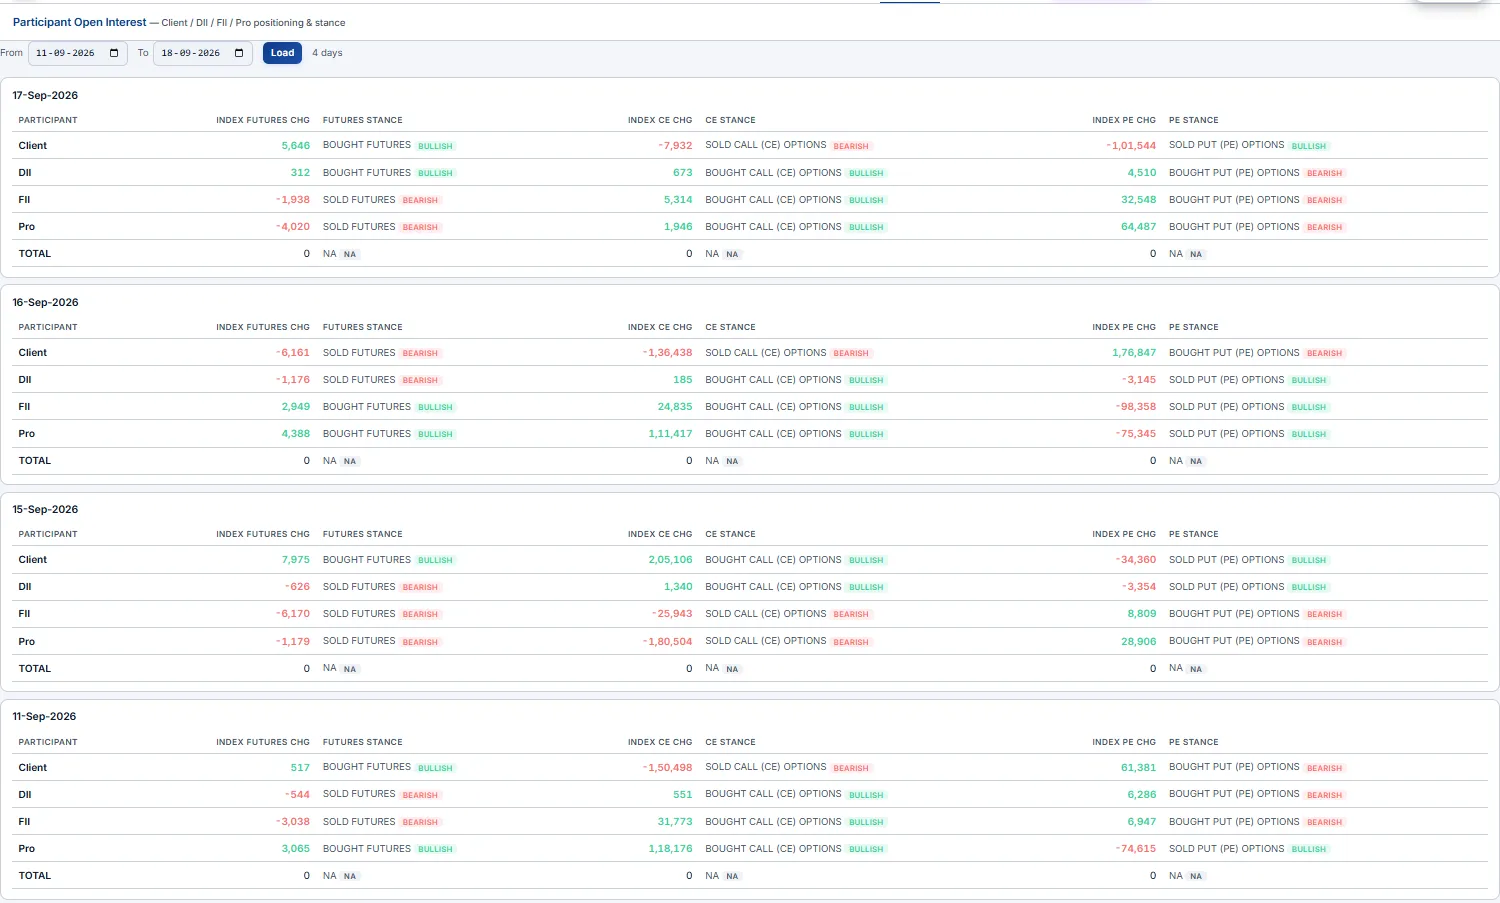
MWPL & ban list
Which stocks can't take fresh F&O positions — and which are about to be banned. Every F&O stock has a Market-Wide Position Limit (MWPL). When market-wide OI crosses 95% of it the stock enters the F&O ban (no new positions, square-off only); it exits only when utilisation falls back below 80%.
The page loads a date and shows Open Interest, MWPL, MWPL % and the previous day's % per stock, colour-coded (amber ≥ 80%, red ≥ 95%), searchable and sortable. From the day-over-day momentum it projects a Ban Outlook chip — BAN IMMINENT, HIGH RISK, WATCH, or for already-banned names EXIT SOON / STUCK IN BAN with an estimated day count. Dedicated sections list the current Ban List, a Ban Watch (closest to entering), and the exchange's possible entrants / exits.
Ban Watch to anticipate the squeeze — names near 95% with rising utilisation often see violent unwinds as the ban forces position cuts.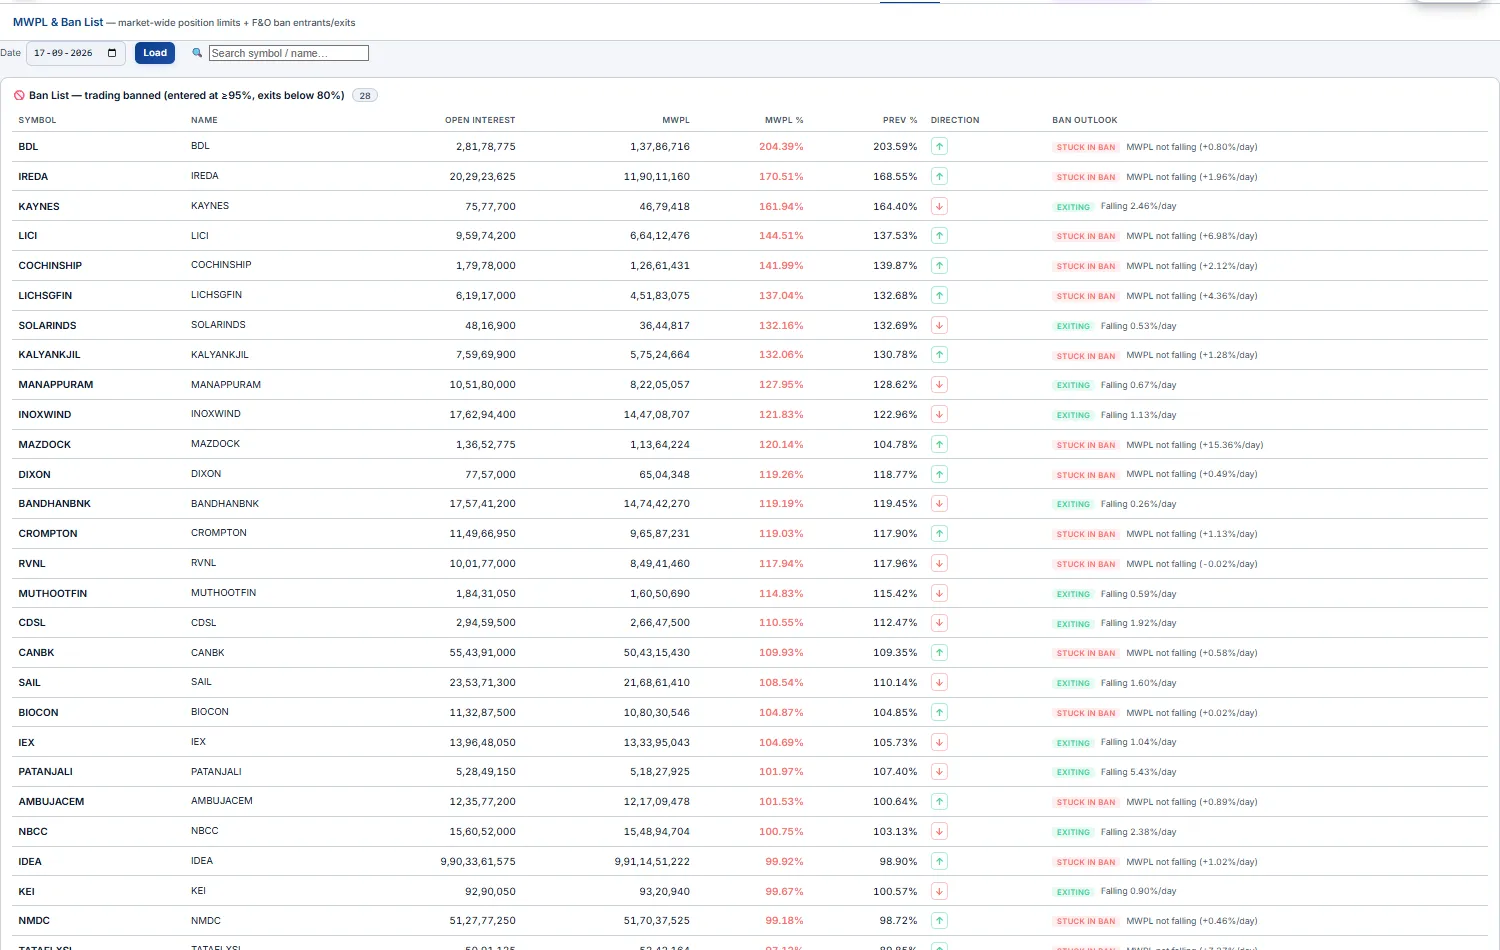
FPI sector flows
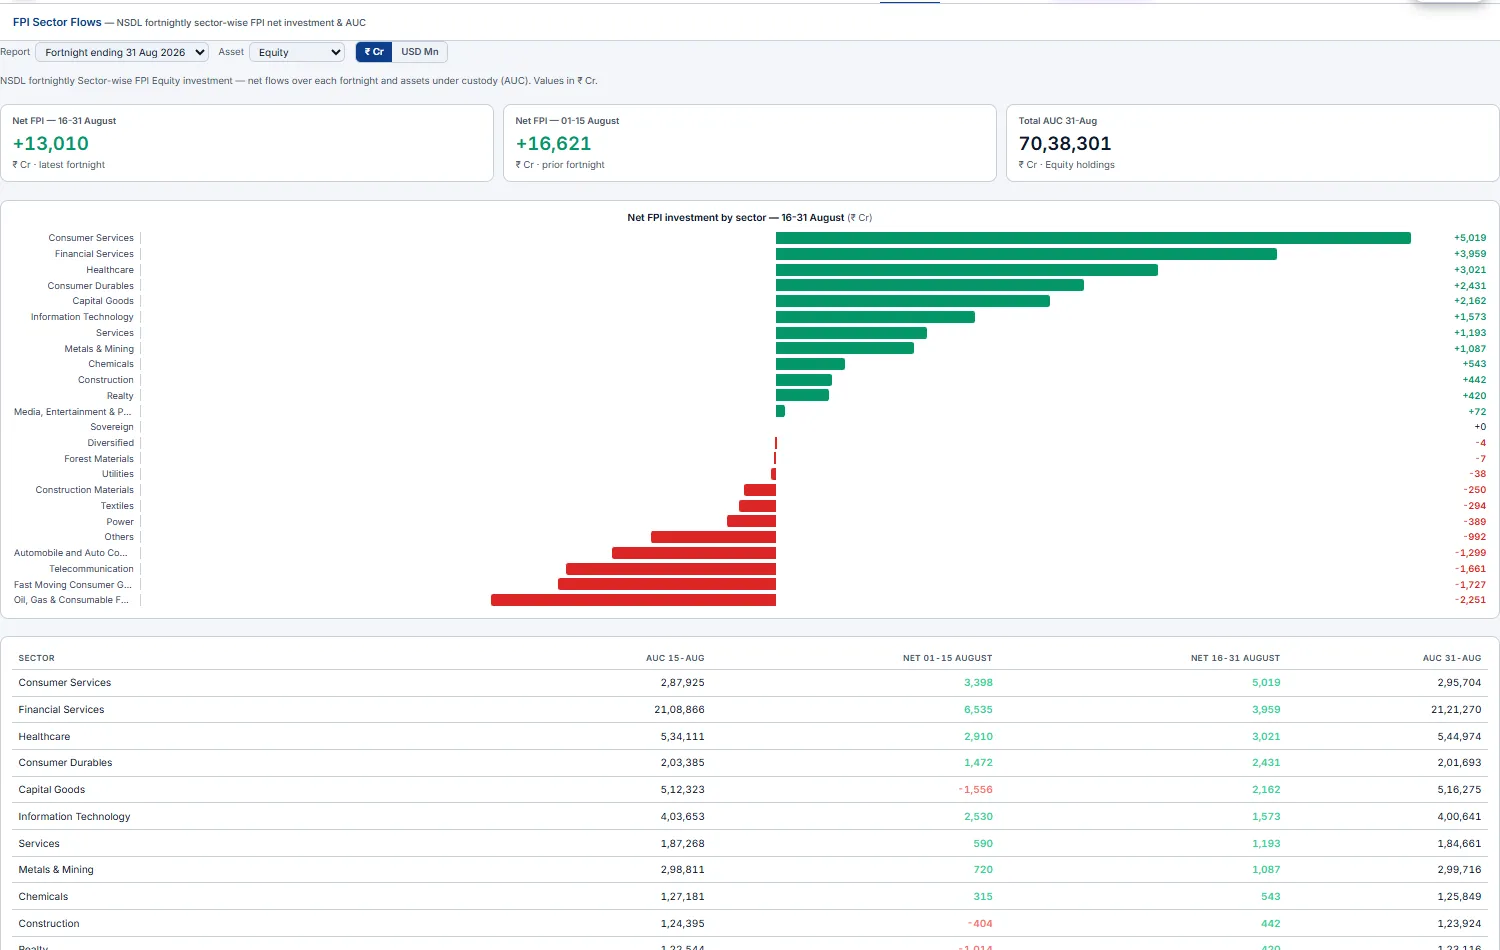
Where foreign money is rotating, sector by sector. Built from the NSDL fortnightly Sector-wise FPI report, this page shows net FPI investment (buys − sells) per sector over each fortnight, alongside AUC — Assets Under Custody, the total value of FPI holdings in that sector (a snapshot, not a flow).
- Pick the report (a fortnight-end date), the asset group (
Equity/Debt/Hybrid/Mutual Funds/AIF), and the currency (₹ CrorUSD Mn). - KPI cards give the grand-total net flow for the latest and prior fortnight plus total AUC; a diverging bar chart ranks sectors from biggest inflow to biggest outflow; the table puts both fortnights' net flows side by side with the AUC endpoints.
Market report
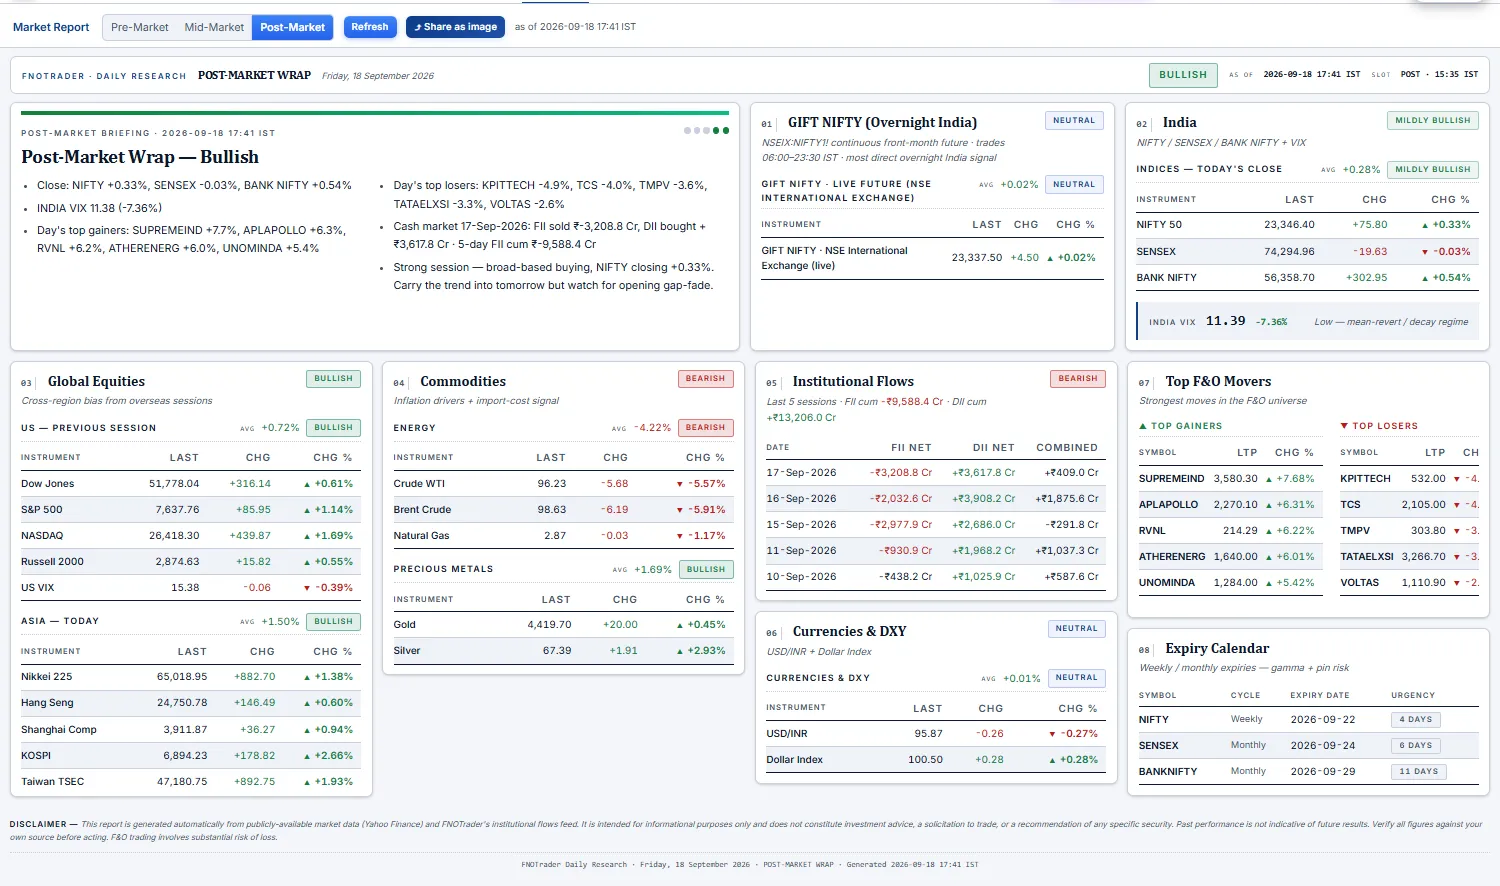
A plain-English wrap of the session, auto-slotted to the time of day. Three briefings rotate by IST clock — pre-market (before ~08:45), mid-market (~12:15) and post-market (after ~15:35) — each with a title, a Bullish → Bearish verdict badge, and a handful of bullets: movers snapshot, index levels, global cues (Asia / US / commodities), and after the close the day's FII/DII cash activity.
You don't have to open the page to get it: on login (once per IST trading day) the current briefing pops as a modal with a "View full report" jump, a topbar button reopens it anytime, and a one-shot toast fires when the mid-market update goes live.
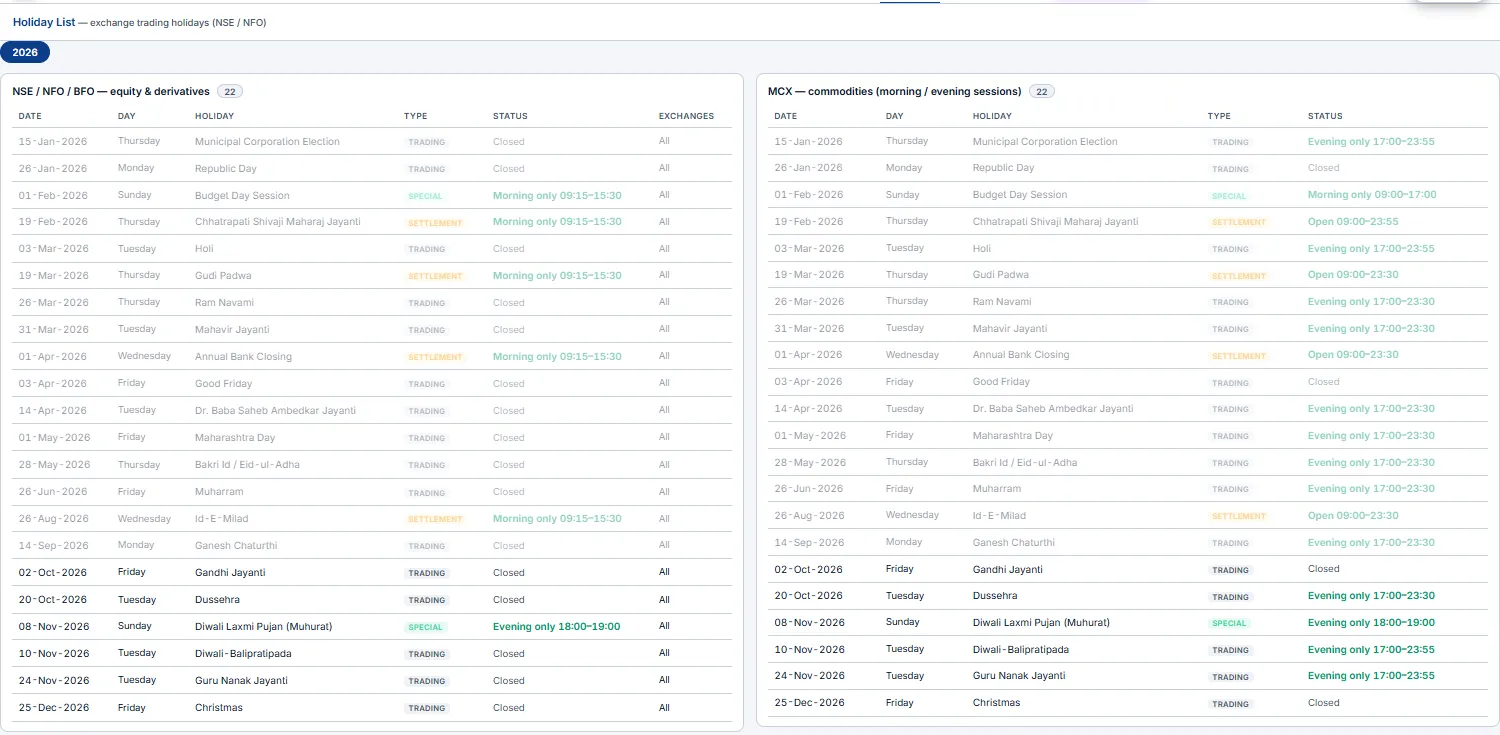
Holiday List Beginner
The NSE / NFO trading-holiday calendar — every closed date with its name — for the current year,
plus any special sessions (the Diwali Muhurat trade). It's the same list the app uses
everywhere it has to be holiday-aware: the alert engine skips these days, charts treat them as
non-trading, and "last trading day" logic on the Dashboard rolls back across them.
2 · Execution & copy trading
The place-and-run half. These pages put real orders on your connected broker account
(routed via Open XTS) — or on the built-in Demo paper account when you just want to
practise. You build a strategy, fire it, monitor every running position with combined
stop-loss / target guards, and exit with one click — and you can mirror a single order across
several accounts with copy trading.
*.fnotrader.com session) and the
Demo paper account works the same. Use it when you just want to place and manage trades.
It has its own focused walkthrough — the Terminal Guide
covers the whole execution desk (order ticket, positions & groups, adjustment rules, monitoring, copy trading).
Option Terminal Intermediate Advanced
Your live order desk. The Terminal is where you place, watch, adjust and exit option orders — on a connected broker account or on a Demo (paper) account. Everything on it updates live from WebSocket ticks. The page has four parts, top to bottom:
- Chart desk — three live charts (CE · middle · PE), each with its own buy / sell bar. See Terminal charts.
- Account bar — the selected account, its live P&L split into Unrealised · Realised · Manual, the
Manual ₹box,+ Place Order,Option Chainand the⚙menu. - Accounts sidebar (left) — every connected account. Click one to switch the whole desk to it. Badges show
DEMO, a copyLEADERor a follower's×multiplier. The‹button folds the sidebar away. - Tabs — Positions · Basket · Custom · Rules · Monitoring · Orders · Trades · Liquidity · Funds · Copier · Journal · Logs.
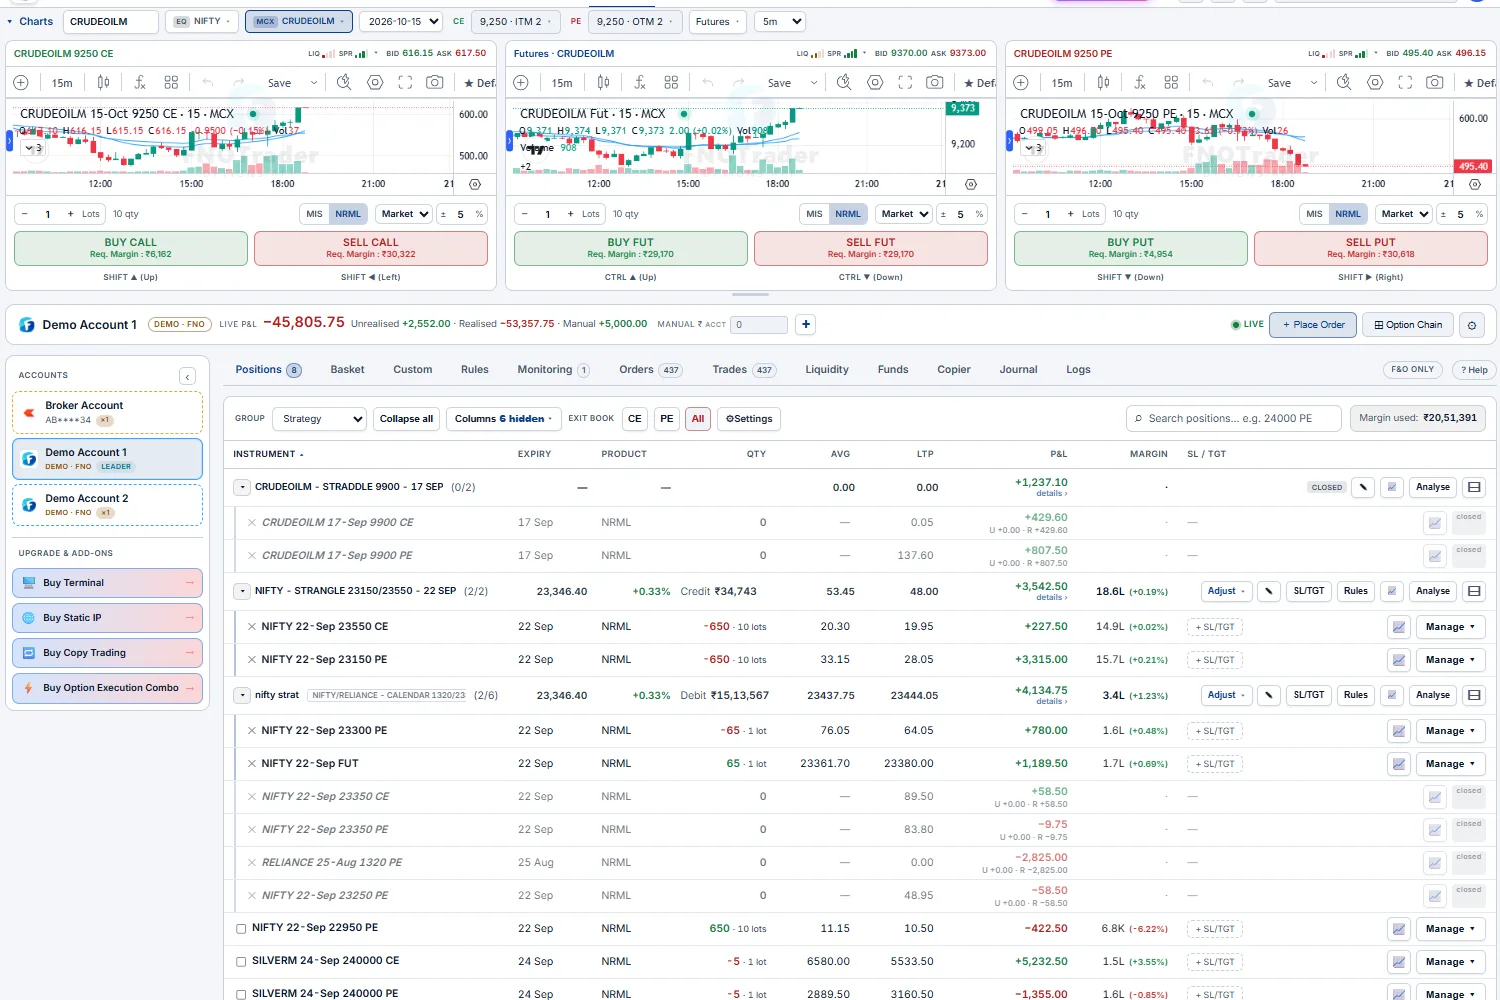
Demo Account 1 — chart desk on top, account bar with live P&L, accounts sidebar and the Positions book with strategy groups.Demo account first — orders fill instantly there with no broker involved. Check the account name in the account bar before you send, and pair every live position with a guard.What each tab is for
| Tab | What you see | Use it to… |
|---|---|---|
Positions | The live book — legs grouped into strategies, P&L, margin, SL / TGT | watch, adjust, guard and exit |
Basket | Legs staged from the chain, with live margin | send a multi-leg structure in one shot |
Custom | A rule-based strategy maker (primary + hedge strikes) | build a structure by distance, premium or delta instead of picking strikes |
Rules | Automation rules — alerts that place an order when they fire | review and edit auto-entry rules |
Monitoring | Every trigger order, group guard and position guard | check what is armed right now |
Orders / Trades | The day's order book and fills | modify or cancel working orders; audit fills |
Liquidity | Depth and spread meters for the charted legs and across the chain | check you can get size done before you trade |
Funds | Available / used margin, SPAN, exposure, premium, collateral, pay-in / out | check headroom before adding risk |
Copier | Copy-trading groups and per-account P&L | mirror one account's trades to others — see Copy Trading |
Journal | Equity curve, MTM calendar and trading stats | review how you trade over days and weeks |
Logs | What the desk did on its own — regrouping, rolls, rule actions | find out why something happened |
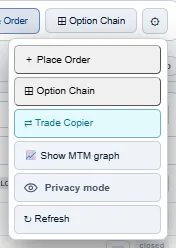
The ⚙ menu
The ⚙ button at the right of the account bar holds the desk-wide tools:
+ Place OrderandOption Chain— the same as the account-bar buttons.⇄ Trade Copier— opens the copier settings (see Copy Trading).📈 Show MTM graph— the intraday MTM line of the account or of one strategy, with Min, Max, Max drawdown, margin used and return on margin.🔗 Share (with image)creates a public link with the chart image, ready for WhatsApp, X or Telegram.Privacy mode— hides every P&L figure behind••••••. Use it when you share your screen; hover a figure to see it yourself.↻ Refresh— reloads positions, orders and funds from the broker.
⚙ menu.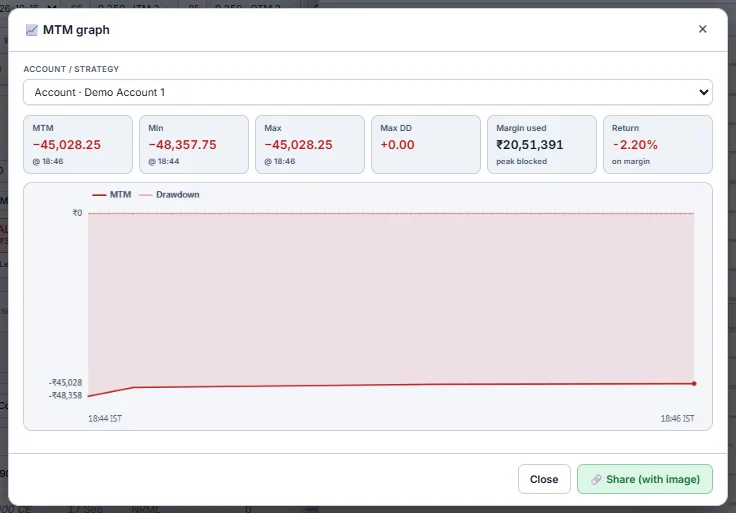
Keyboard shortcuts
With the charts showing, the arrow keys send the chart's order bar straight away (with the confirmation ticket if you keep confirmation on):
| Keys | Order |
|---|---|
Shift + ↑ / Shift + ← | Buy / Sell the CE pane |
Shift + ↓ / Shift + → | Buy / Sell the PE pane |
Ctrl + ↑ / Ctrl + ↓ | Buy / Sell the middle pane (futures, straddle or Rolling ATM straddle) |
On a phone
On a narrow screen the Terminal switches to a card layout: one card per position (qty, average, P&L, LTP), an Invested / Current / P&L summary, and a bottom bar to move between Chart, Book and Accounts. Every action from the desktop book is still there.
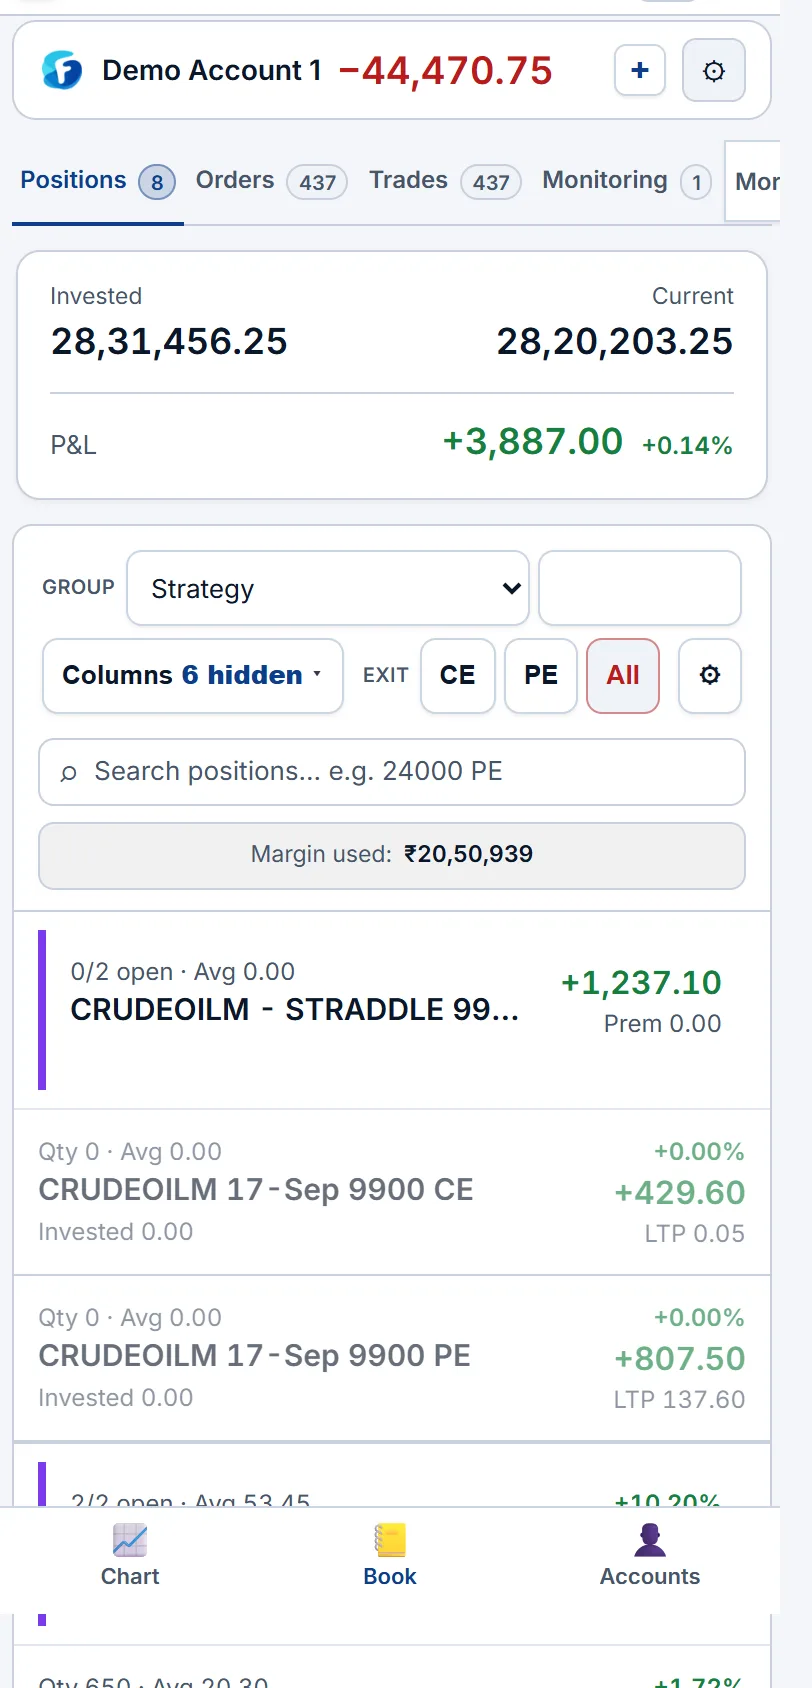
Positions book — groups, columns and search
The book shows every open position, grouped the way you think about it. The toolbar above the table sets how it is laid out:
- Group —
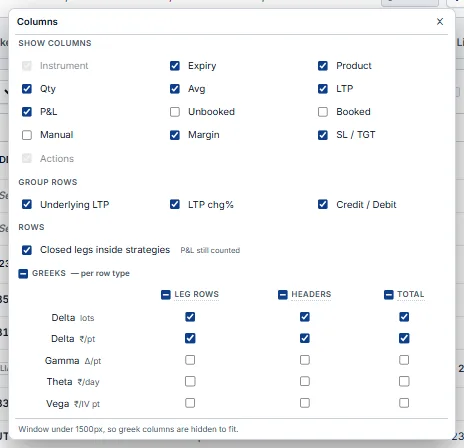
Strategy(legs you traded together sit under one header),Symbol, orSym + Expiry.Collapse allfolds every group to its header. - Columns — choose which columns show (Expiry, Product, Qty, Avg, LTP, P&L, Unbooked, Booked, Manual, Margin, SL / TGT), what group headers show (underlying LTP, LTP change %, credit / debit), whether closed legs stay inside their strategy, and Greeks (Delta in lots and ₹/pt, Gamma, Theta ₹/day, Vega ₹/IV pt) separately for leg rows, headers and the total. On windows narrower than 1,500 px the Greek columns are hidden to fit.
- Exit account —
CE,PE,Allsquare off every call, every put, or the whole account. - ⚙ Settings — the Account P&L guard,
Ignore hedges(Exit CE / PE / All then close only short legs and keep bought hedges), Account SL / TGT, andEdit defaults(default order type, buffer, leg sequencing). - Search — filter rows by strike or name, e.g.
24000 PE. Margin used shows the account's blocked margin.
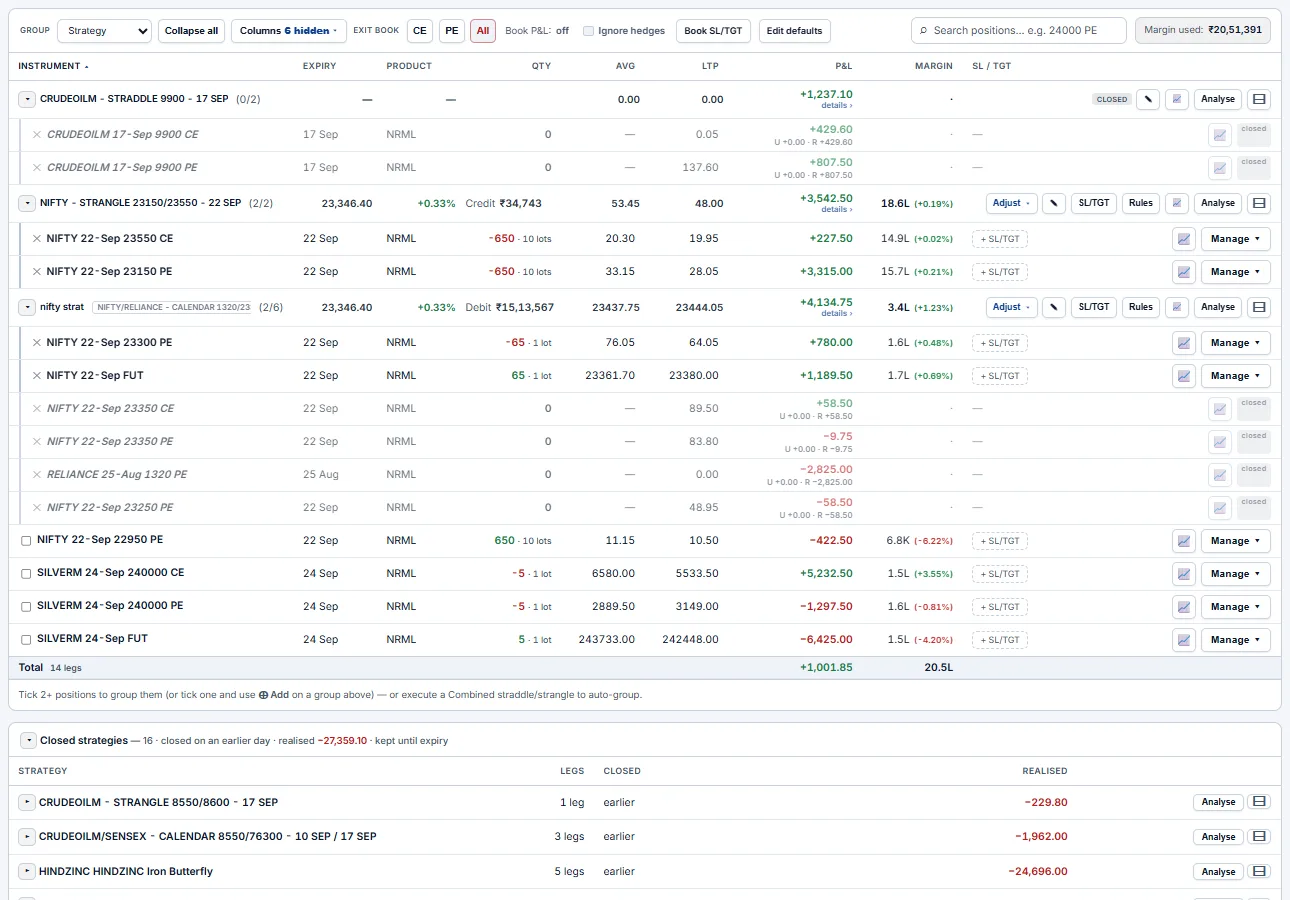
A strategy header reads like one position: NIFTY - STRANGLE 23150/23550 - 22 SEP (2/2) is the name and how many legs are still open; then underlying LTP and change, Credit or Debit, the average and current combined price, P&L (click details ›), and margin. Its buttons:
Adjust ▾— add lots to every leg, exit a quantity (Quick · ¼ · ½ · Full; CE, PE or All), or roll every strike ↑ up, ↓ down, ↔ wider or →← closer.✎— rename the strategy.SL/TGT— the group guard (see Risk).Rules— adjustment rules for this strategy (see Adjustment rules).📈— load the strategy on the charts (CE, PE and combined premium).Analyse— open it in the Strategy Builder with payoff and Greeks.⊟— collapse or expand.- A fully closed strategy shows a
CLOSEDbadge and its realised P&L; Ungroup forgets it.
Strategy P&L (details ›) splits the group into Unrealised · Realised · Manual · Total, leg by leg. Manual ₹ adds an amount you booked elsewhere (use − for a loss); it counts in the strategy's P&L, its P&L-based guard and the account total.
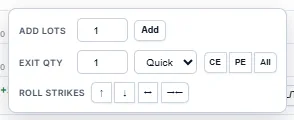
Adjust ▾ menu.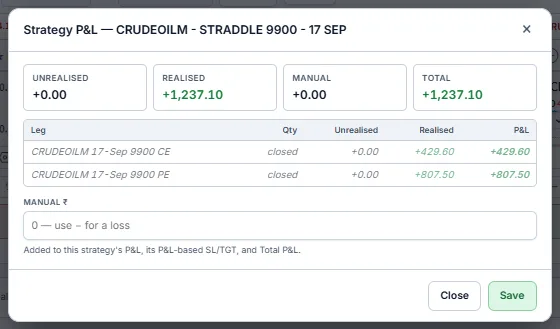
Below the open book three folding sections keep the day's history: positions you closed or squared off today (with realised P&L), legs the broker reports flat that are not in any strategy, and settled contracts. Each row's chart icon opens that contract on the charts.
Order ticket — place a single order
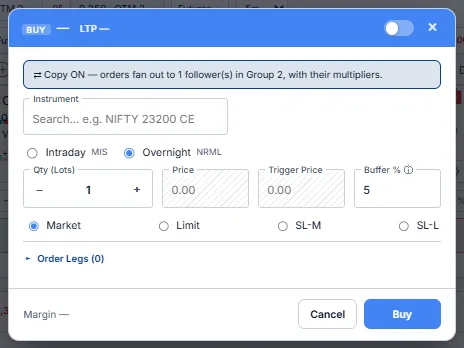
The order ticket is the same window the Trade app uses. Open it with + Place Order, from the chain, or from a chart. The header shows the side and LTP, and the colour of the send button matches the side.
- Instrument — type to search (e.g.
NIFTY 23200 CE). Product —Intraday (MIS)orOvernight (NRML). - Qty (Lots) — a
−/+stepper in lots. Price and Trigger price open only for the order types that use them. - Order type —
Market,Limit,SL-MorSL-L. A Market order is sent as a protected limit at LTP ±Buffer %, so it can't fill far from the screen price. - Order Legs — stack more legs to send a combination in one go. SL / TGT (collapsed) attaches a stop and target to the new position as it fills. Margin shows the required margin before you send.
- If copy trading is on, a banner says how many followers the order fans out to.
Market with a small buffer — you get a near-instant fill that still can't slip far from the screen price. Multi-leg orders go hedge-first by default, so the bought leg is on before the short.Basket — build a multi-leg, send once
Stage every leg, check the real margin, then send them together. With QuikTrade off, clicking B / S on the chain panel drops that strike into the Basket instead of sending it. Name the structure, check the hedged margin, then send all legs in one go.
- Columns — Side · Instrument · Product · Order type · Lots · Qty · LTP · Est. ₹ · Margin · remove. A
×multiplier scales every leg at once. - Hedged margin — each leg's margin and the combined total are priced live, so you see the hedge benefit before you commit.
- Execute basket — sends all legs (hedges first) and groups them in the book as one named strategy.

Custom — build a strategy from rules
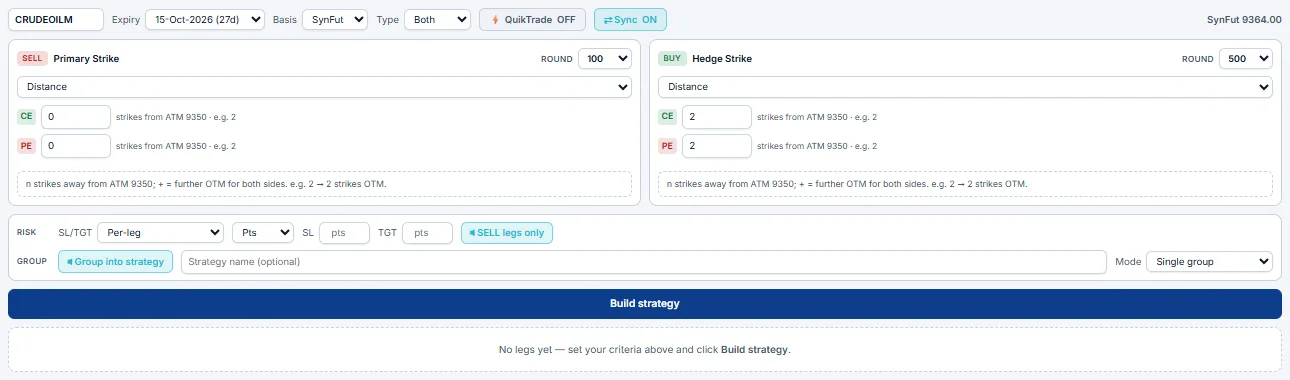
Describe the structure; the desk picks the strikes. The Custom tab builds a primary (sold) and a hedge (bought) leg pair from rules instead of fixed strikes, so the same recipe works on any day.
- Top line — symbol, expiry,
Basisfor ATM (spot, futures or synthetic future),Type(CE, PE or Both),QuikTradeandSync. - Primary Strike and Hedge Strike — each has a side, a strike
Round, and a criterion:Strike,Distance(n strikes from ATM),Premium,Delta,Straddle PremiumorUnderlying %, with separate CE and PE values. - Risk — SL / TGT
Per-legorCombined (strategy), in points or %, optionally on SELL legs only. - Group — group the result into a strategy (optional name), as a
Single grouporSplit: Shorts / Hedge. Build strategylists the resolved legs; review them before you send.
Terminal charts — trade straight off the chart
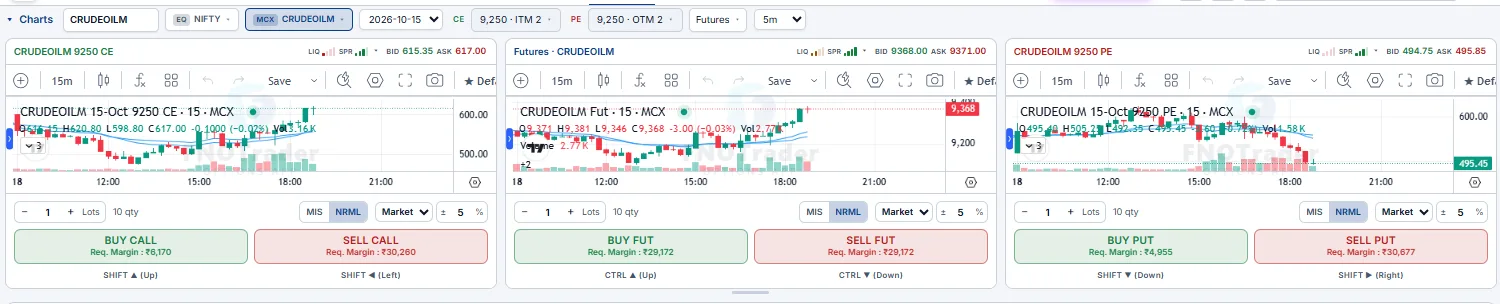
Three live charts wired to the order engine. The Terminal carries its own charts — CE | middle | PE — so you watch both legs and the underlying at once and send, arm or protect orders without leaving them.
- Chart bar — symbol (equity or MCX), expiry, the CE and PE strikes (shown as ITM / OTM n), the middle-pane mode and the timeframe. The middle pane plots
Spot,Futures,Combined Prem(CE + PE) or theRolling ATM Straddle. - Pane header — the contract,
LIQandSPRmeters (depth and spread), and live bid / ask. - Order bar under each pane — lots,
MIS/NRML, order type, buffer %, andBUY/SELLbuttons that show the required margin and their keyboard shortcut. - Right-click to trade a level — the menu reads your click price against LTP and offers the right order: a stop-limit breakout above, a limit below (the reverse for sells), or market. It also offers
⚡ Trigger Buy / Sell(a conditional order that fires when LTP — or combined premium — crosses the level) and, for a pane tied to an open position or group,Set Target/Set Stop-lossat that exact price. - Indicators — VWAP, OI, OI EMA10, OI EMA20 and IV. Overlays show your entries, armed triggers and SL / TGT lines.
⚡ Trigger Buy breakout, then right-click your exit level to set a target — both sit on the chart and both are watched server-side.Option chain panel
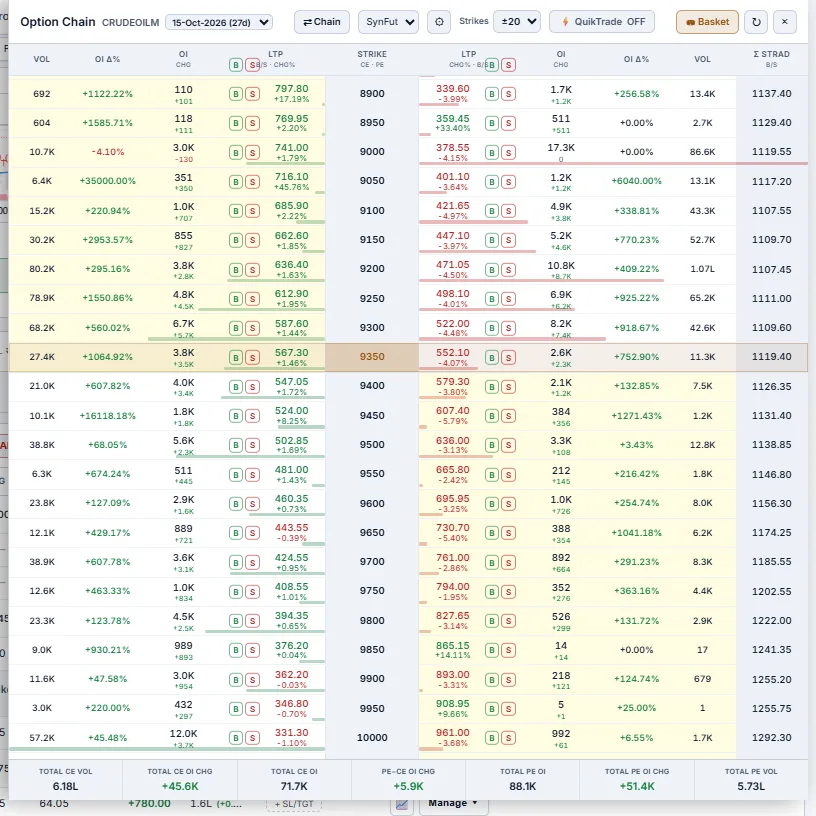
The chain opens beside the book, so you can pick strikes without leaving the Terminal. Each row has B / S buttons for the CE and the PE, plus OI, OI change, volume and Σ STRAD (straddle premium, with its own B / S). The header sets expiry, Chain / strangle view, the ATM basis (e.g. SynFut), the number of strikes, QuikTrade and Basket. Totals for CE / PE volume and OI sit at the bottom.
- QuikTrade OFF (default) — B / S opens the ticket, or drops the leg in the Basket.
- QuikTrade ON — B / S sends the order at once. Use it only when you are sure of the account and size.
Manage a position — Add · Exit · Reverse · Roll
Every open position has one-click adjustments. Click Manage ▾ on a row to open its panel:
- Add — add the lots you type, on the same side.
- Exit — close the lots you type, or use
¼,½orFull. Reverse flips the position. - Roll —
Risk ON ▸moves the strike towards the money,◂ Risk OFFmoves it further out, by the number of strikes you type. A roll is two orders — close the old strike, then open the new — and the new leg rejoins its strategy on fill.

For a whole strategy use the header's Adjust ▾ (see Positions book); for the whole account use Exit account CE / PE / All. With Ignore hedges on, those exits close only the short legs. There is no expiry roll — rolls change strikes only.
Risk OFF on the CE leg pushes it further out, or Adjust ▾ → ↔ wider rolls the whole structure — legs stay grouped and the guard stays on.Risk management — guards that exit for you
Set the level once; the engine checks every tick and squares off at your number. Protection works at three scopes — leg, strategy and account — and each scope has the same five tools: Stop-loss, Target, Trailing SL, Profit locking and Profit trailing. ₹ amounts format in Indian notation as you type.
Guards run on the server. Once saved, your levels keep being enforced with the Terminal closed — on Demo and real accounts alike. There is no switch to turn this on.
- Leg —
+ SL/TGTon a row. Levels in₹ Price,Points,%(from LTP),₹ P&Lgive-back, or an underlyingSpot/Futureslevel. The header shows side, quantity, average, LTP and P&L so you can place the level sensibly. - Strategy —
SL/TGTon a group header. One rule for the whole structure, on the basis you choose:Combined Premium,Group P&LorUnderlying. A breach exits every leg together. - Account —
⚙ Settings → Account SL/TGT. Levels on the live account total (unrealised + realised + manual). Enter the real P&L value:25,000exits in profit if the total falls back to +25,000;-10,000is a loss limit. A breach squares off every position.
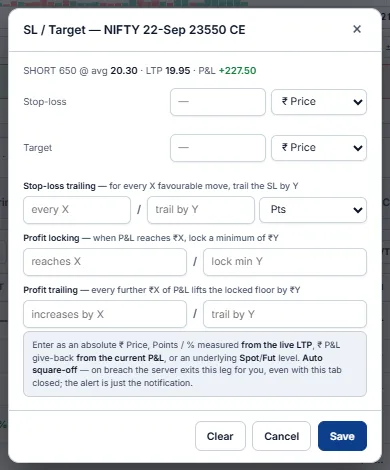
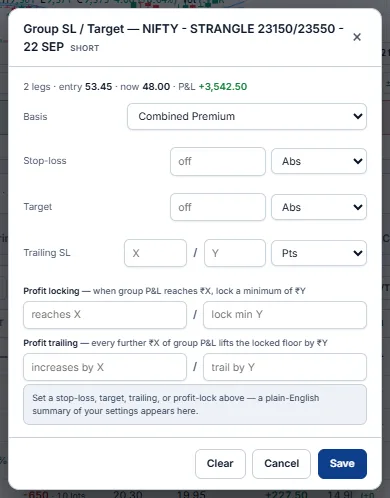
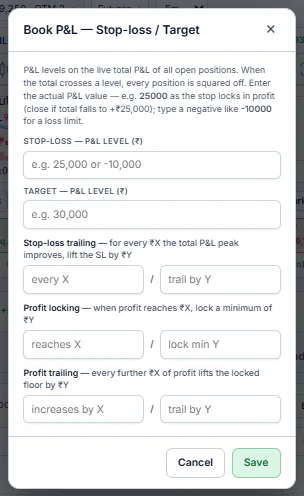
Profit locking & trailing — the P&L floor
Lock and trail work on one idea: a floor under your profit that only moves up. When P&L reaches the lock level ₹X, the floor is set at your minimum ₹Y; each further ₹A of profit lifts it by ₹B. If P&L falls back to the floor, that scope exits and you keep the locked amount.
Trailing stop-loss
"Every X the trade moves my way, move the stop by Y." On a leg, X and Y are points or % and the stop follows the option price; on a group or the book they follow P&L. The trail works off the peak — it never gives a step back.
Monitoring tab — everything that is armed
One page lists every trigger order (condition, action, status — ARMED, FIRED or EXPIRED — and the price it fired at), every strategy-group guard (basis, average, now, stop, target, trailing, lock, trail) and every position guard.
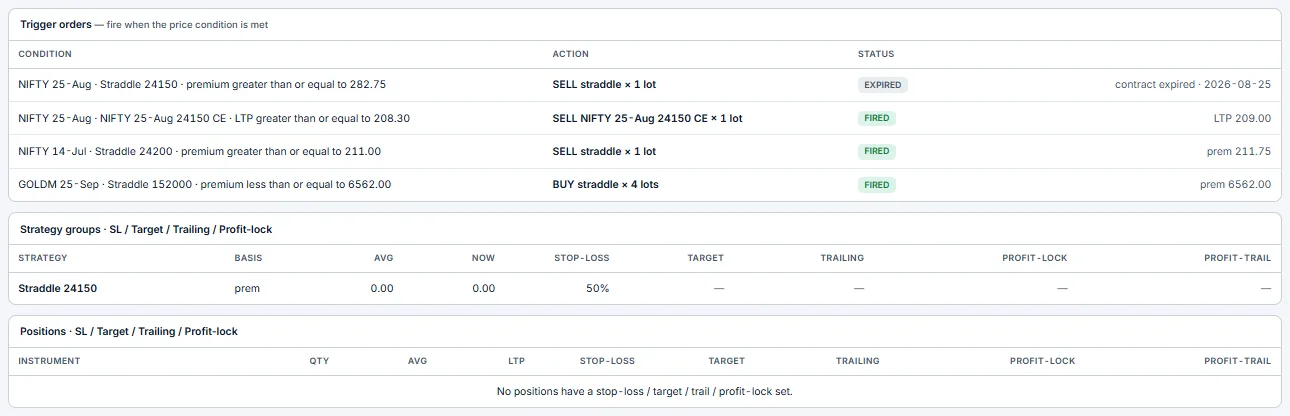
-10,000, profit lock at 25,000 keep 10,000, profit trail 5,000 → 2,000, and a Combined Premium guard on each strangle — then step away. The worst day ends near −10k, and winners get locked in on the way up.25,000 exits you in profit, -10,000 is a loss limit.Adjustment rules — the engine manages the strategy for you Advanced BETA
Guards exit; rules adjust. Where an SL/target just closes a position at a number, an adjustment rule actively works a running options strategy tick-by-tick — it rolls, re-centers, rebalances, scalps or exits legs for you so a short strangle/straddle can be run hands-off. Open them with the Rules button on a strategy header. Each saved rule shows a plain-English summary and flags itself N/A when it doesn't fit the strategy's current shape. There are seven rule types:
| Rule | Fires when… | …and does |
|---|---|---|
| Roll / exit a leg at a price level | a leg's LTP hits a per-side level — CE at X, PE at Y — in % of entry, Pts from entry, or Abs ₹ | rolls that leg away (further OTM), in (closer) or squares it off, by N strikes. Each CE/PE strike arms independently off its own entry. |
| Price-diff band (entry vs LTP) | a leg's LTP goes ≥ entry+band or ≤ entry−band (CE±X, PE±Y, pts or %) | runs an independent UP and DOWN action (roll away / roll in / square off) so you defend a tested leg and harvest a decayed one. |
| Leg divergence (|CE−PE| gap) | the CE vs PE premium gap (50/50 → 40/70 = 30) reaches a threshold (% of total or ₹ abs) | acts on the winner (roll in / match a % of the loser / exit) and the loser (roll away / exit) independently — keeps a neutral strangle balanced as price trends. |
| Rebalance at ratio alert | one leg's premium ≥ N× the other | alerts you to move the winner to X% of the loser's premium (signal only — no auto-order). |
| Spot re-center | the underlying moves ≥ X% or ≥ X points (pick % / Pts) from entry, measured on your chosen ATM basis — Spot / Futures / Synthetic-future | closes both legs and re-opens at ATM ± offset strikes — keeps a straddle/strangle centred on the money as the index drifts. |
| Re-entry (scalp out & back in) needs Auto | the combined premium crosses your exit level, then later your re-enter level | scalps the same premium band out and back in, up to N times a day. |
| Leg re-entry needs Auto | a sold leg crosses its exit level, then its re-enter level (₹, points or % from entry) | scalps each sold leg out and back in on its own, up to N times a day. |
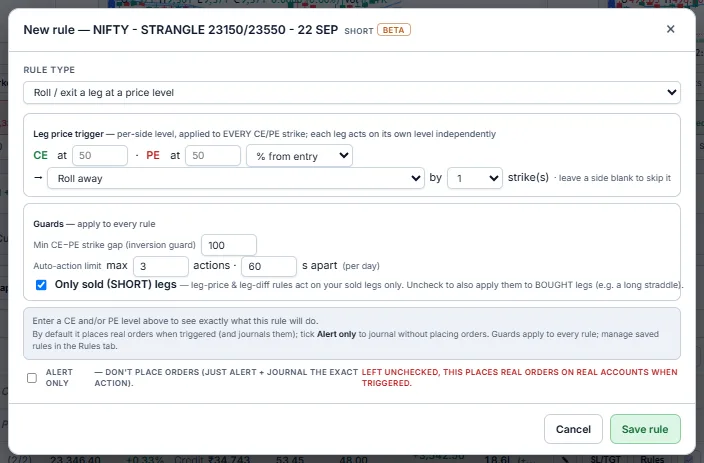
Guards — apply to every rule on the strategy
- Min CE−PE strike gap (inversion guard) — never lets a roll cross the legs (the CE strike stays above the PE strike by at least this gap).
- Auto-action limit — caps at
max N actionsper day, each≥ S secondsapart, so a whipsaw can't over-trade your account. - Only sold (SHORT) legs — checked by default. Leg-price and price-diff rules then act only on the legs you sold — the ones carrying assignment risk. Uncheck it to also manage your bought legs — do this when you run a long straddle/strangle and want the rules to work your long legs (e.g. take profit / roll on a move) instead of ignoring them.
Demo first, and keep the Auto-action limit tight. Leg-price / price-diff rules need a sold leg (unless you unchecked Only sold); divergence, rebalance, spot and re-entry need a 1×CE + 1×PE straddle/strangle shape.Strategy Builder — the most powerful page
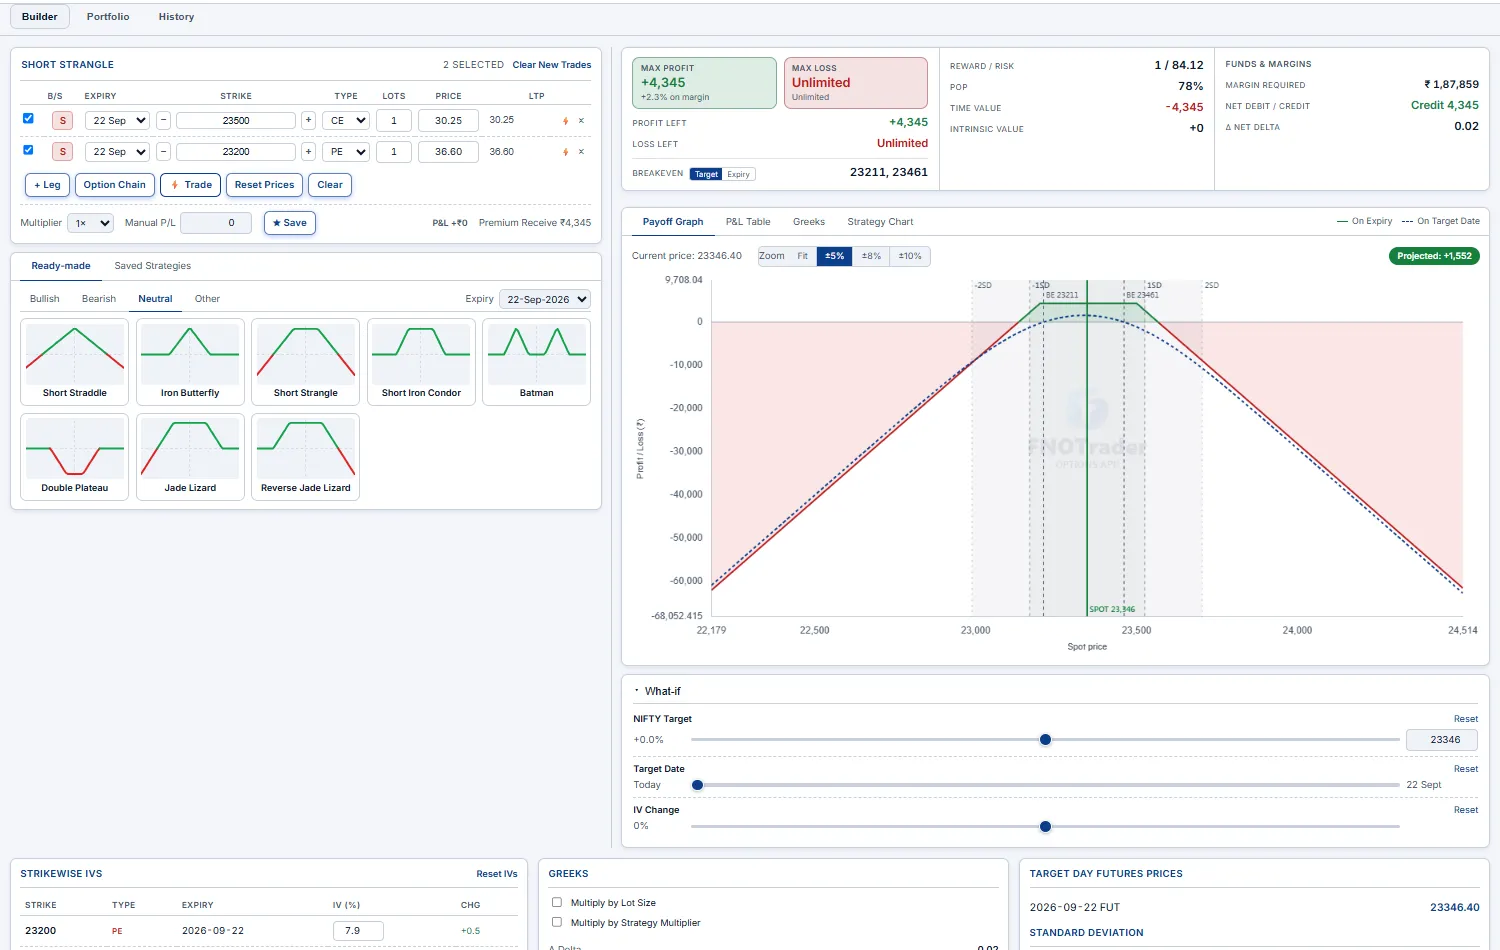
Where a view becomes an executable trade. Build any multi-leg option strategy (manually or from 36 ready-made templates), then see live margin, payoff at expiry and at any target date, Greeks, breakevens, POP and reward/risk before you put money down. The legs editor lets you set B/S, per-leg expiry (calendar/diagonal allowed), strike, CE/PE, lots and a planning price; a Multiplier (1×–10×) dry-runs a bigger size.
Once you like the structure you can execute it straight from the builder. The Execute sequencer respects an onLegFail policy — all-or-nothing: if any leg fails (margin or other), the legs that did fill are cancelled/squared off so you're never left holding a partial strategy. You choose paper (the Demo account, for risk-free practice) or real (a connected broker account), and the same legs land in the Terminal book as a grouped strategy you can monitor and exit.
Rules, Liquidity, Funds, Journal & Logs Intermediate
The rest of the Terminal's tabs — what each shows and how to read it.
Rules tab — automation rules
Alerts that place an order when they fire — auto-entry of a leg or a strategy. Each row shows the symbol, what it places, and whether it trades on a PAPER or real account. Edit opens the full alert window; + New rule creates one. (Adjustment rules for a running strategy live on its header — see Adjustment rules.)

Orders & Trades
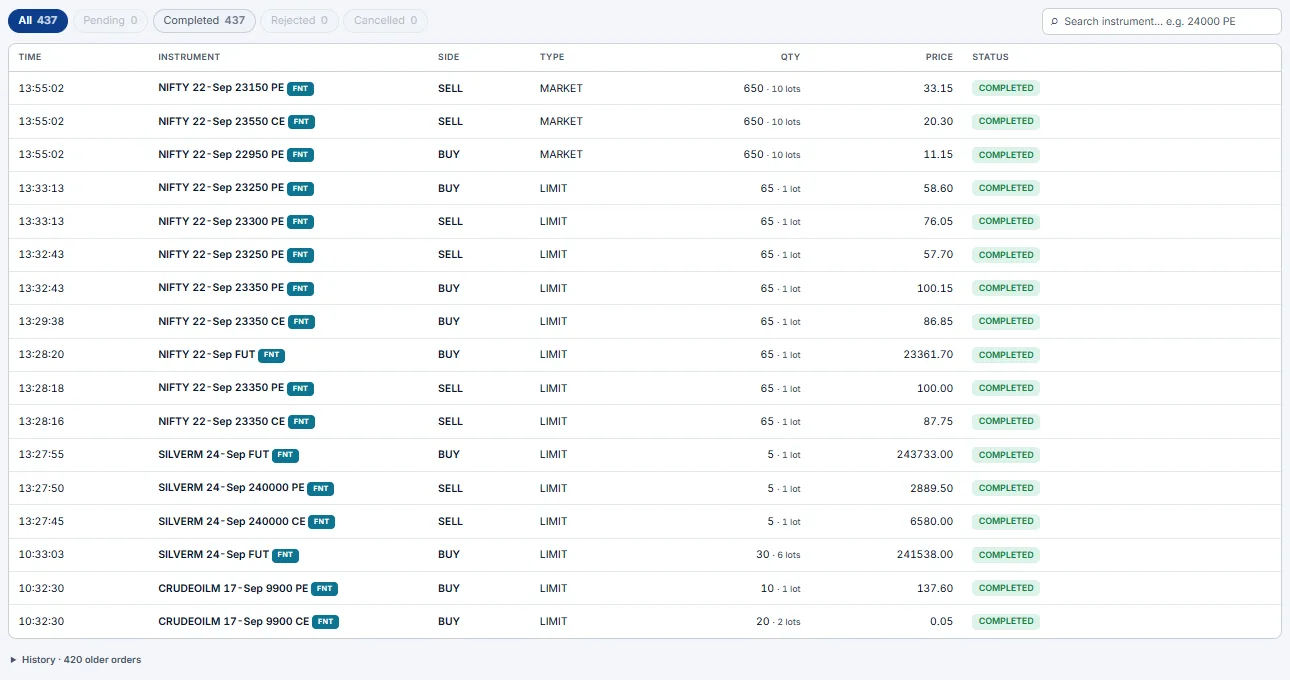
Orders is the day's order book — status, type, price and fill for each order, with modify and cancel for working orders. Trades lists each fill. The count on each tab is today's total.
Liquidity
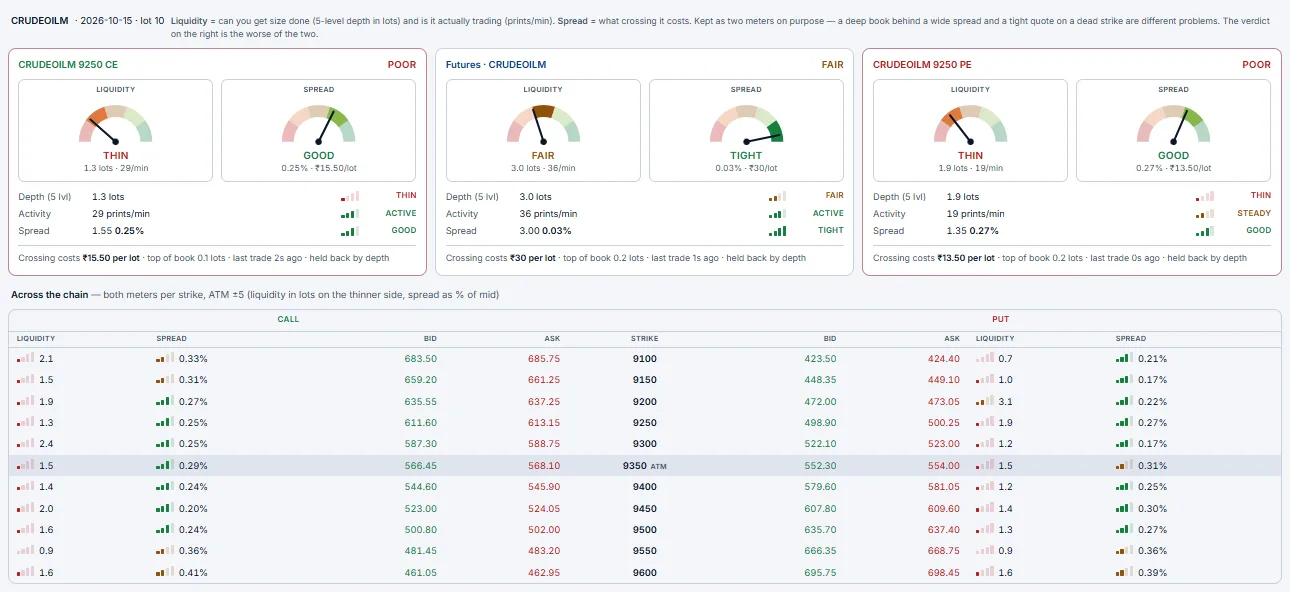
Can you get size done, and what will crossing the spread cost? For the three charted contracts, two meters: Liquidity (5-level depth in lots and prints per minute) and Spread (% of mid and ₹ per lot). They are kept apart on purpose — a deep book with a wide spread and a tight quote on a dead strike are different problems. The verdict is the worse of the two. Below, both meters for every strike around ATM.
Funds
The account's margin picture: available and used margin, opening balance, SPAN, exposure, option premium, collateral, delivery margin, pay-in and pay-out.

Journal
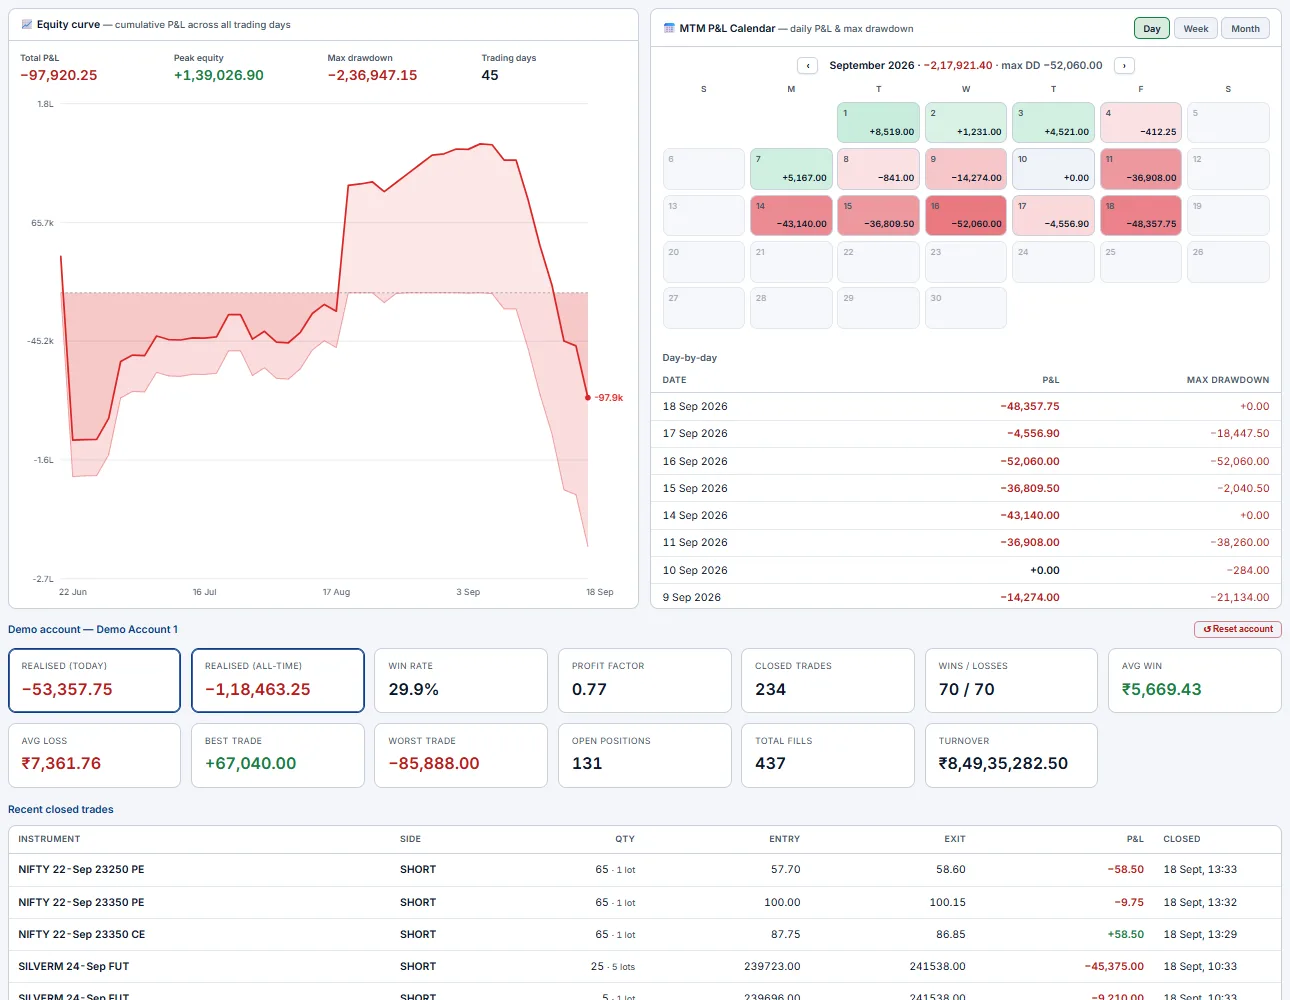
Your trading record. An equity curve of cumulative P&L with peak equity and max drawdown; an MTM calendar (Day / Week / Month) coloured by daily P&L, with a day-by-day list; and stats — realised today and all-time, win rate, profit factor, closed trades, wins / losses, average win and loss, best and worst trade, open positions, fills and turnover. Recent closed trades lists entries and exits. On a Demo account, Reset account starts it afresh.
Logs
What the desk did on its own, with the time and account: legs rejoining a strategy after a roll, a rolled leg that never appeared in the book, rule actions. When something moved without you, look here first.

Strategy Chart Intermediate
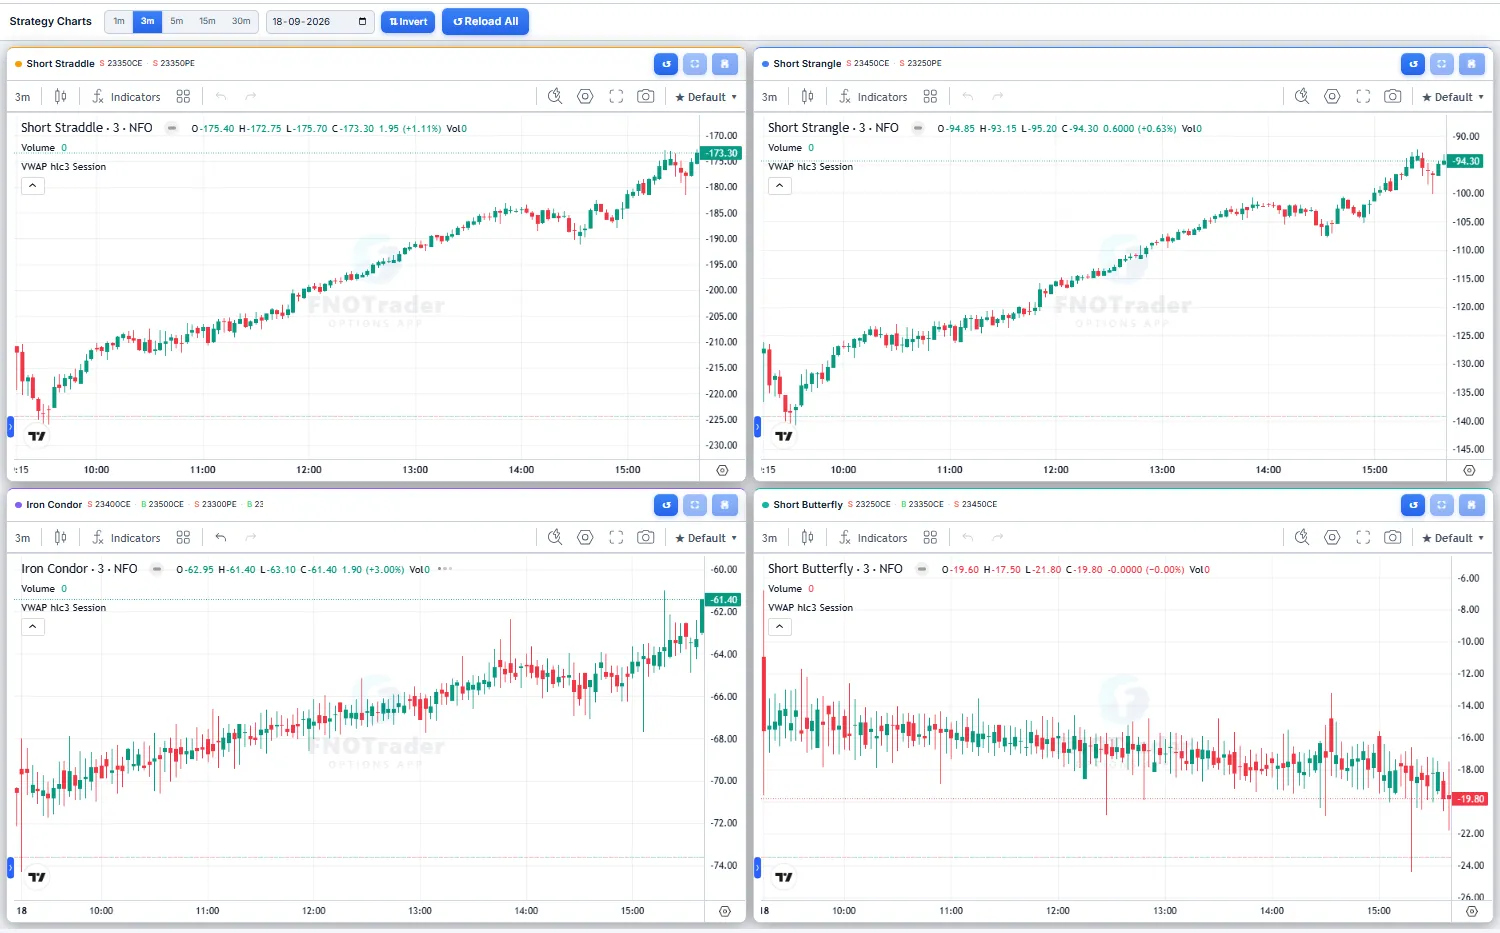
Watch candidate structures play out side by side. A 2×2 grid where each panel plots a full multi-leg strategy's combined premium against intraday bars (1m–30m). Edit legs inline or quick-fill a preset (straddle, strangle, spread), switch each panel between candle and line, and overlay EMAs.
It's a pre-trade rehearsal: see how several what-if strategies would have moved through today's session before you commit one of them in the Builder or Terminal. The strategy series for a straddle/strangle is the live CE+PE sum, so the chart tracks exactly the premium your position's P&L rides on.
Buyer Intermediate
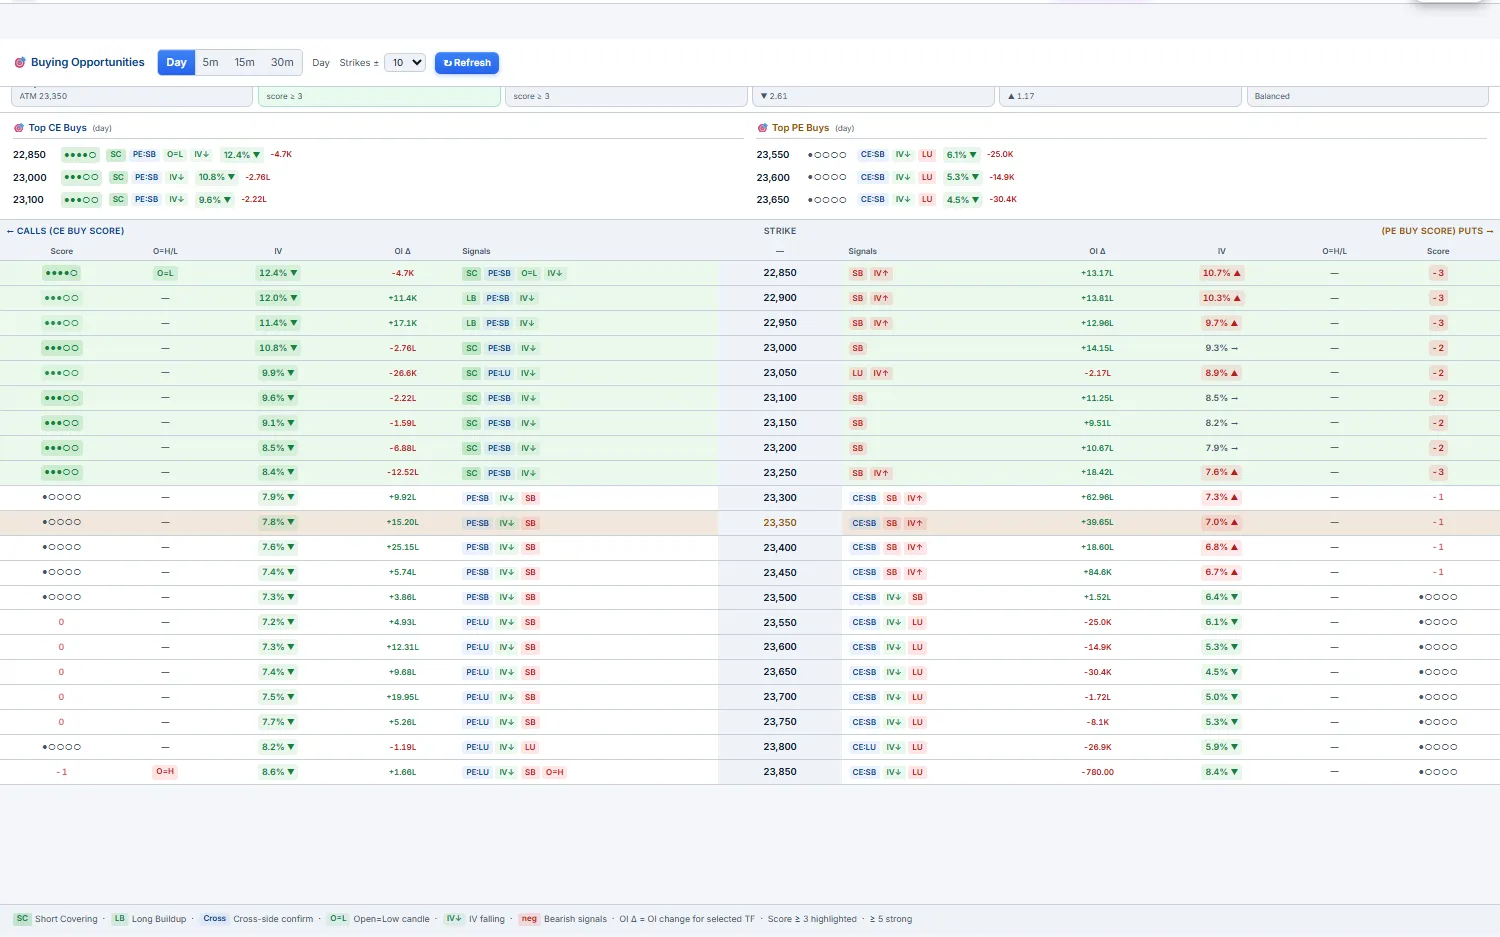
A buying-opportunity scorecard for option buyers. Buyer ranks CE and PE strikes by a composite signal built from OI buildup, IV slope, and open=high / open=low candle behaviour. Pick a timeframe (day / 5m / 15m / 30m) and a strike range (± from ATM); strikes scoring ≥ 3 are highlighted, with a signals legend and cross-side confirmation so you can sanity-check a CE call against the PE side.
It's a starting-point screen for directional buyers — a place to find which strike has the cleanest tailwind before you take it to the Builder or Terminal — not a recommendation. Education-only — no SEBI advice.
Brokers Intermediate
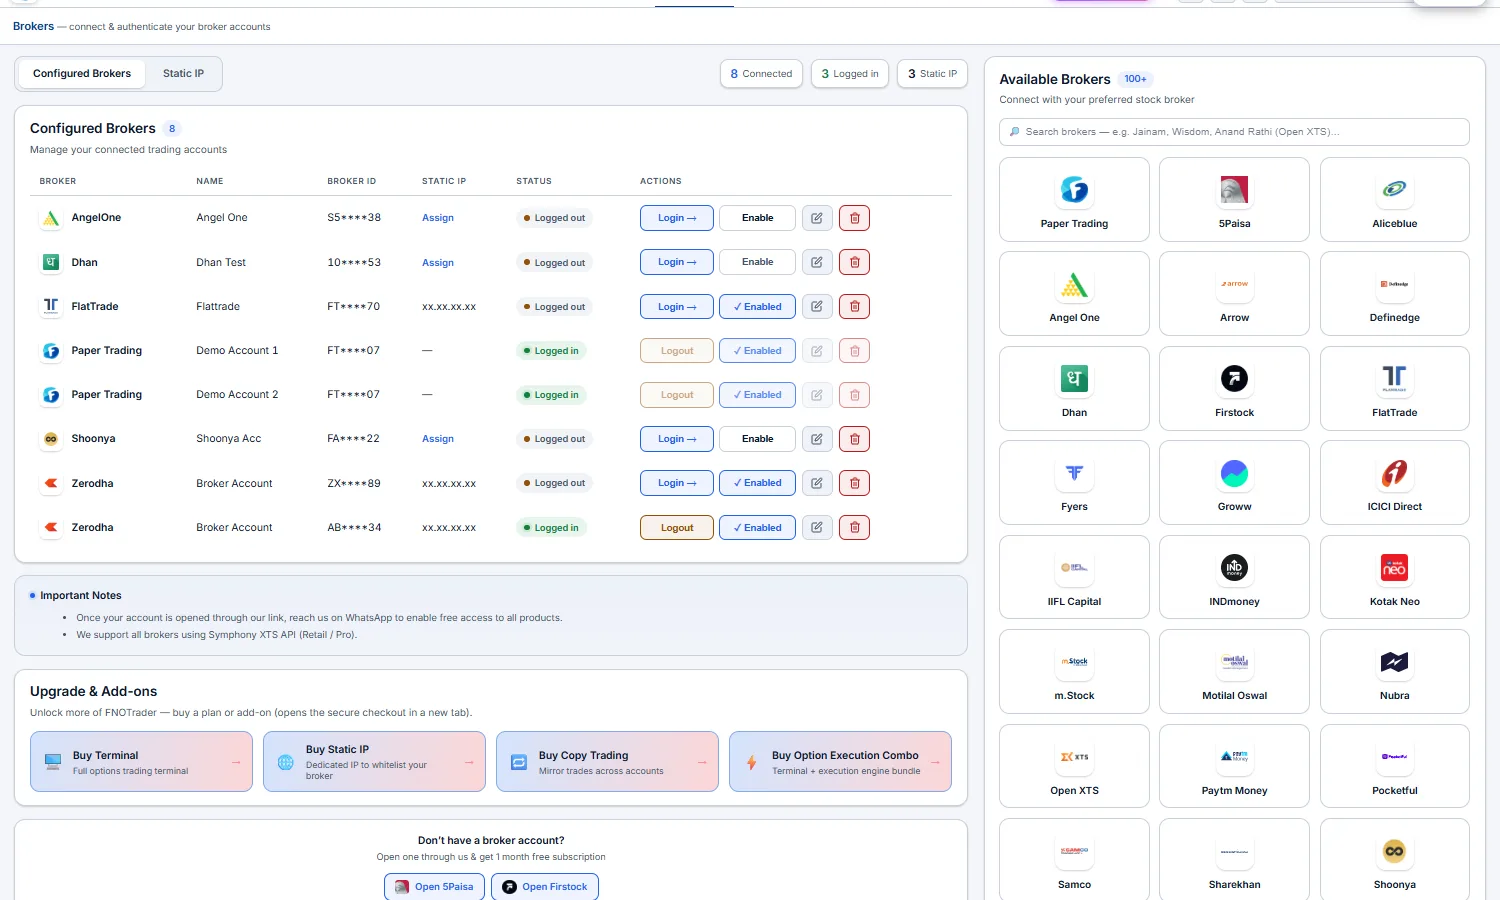
Connect the real broker accounts you'll trade through. FNOTrader routes orders via Open XTS, so 80+ brokers are supported — add an account with its API/secret credentials, complete the broker's own login / 2FA, and the row shows live connection status. You never hand this app your broker password; the broker's own auth handles that.
- Configured Brokers — one row per account: broker, name, masked broker ID, static IP, status (
Logged in/Logged out), and actions —Login →(the broker's own login),Enable, edit and delete. The counters at the top show connected, logged-in and static-IP accounts. - Enable for trading — an account must be
Enabledbefore the Terminal, Builder, alerts or copy trading can route orders to it. Disabling is always allowed. - Static IP — brokers now require orders to come from a registered IP. The
Static IPtab assigns one to an account (Assign); buy one from Add-ons if you need it. - Paper Trading — Demo accounts are listed like brokers and are always logged in.
- Broker slots — how many real accounts can be enabled at once = 1 + any Additional Broker Accounts you bought. Going over shows a "limit reached" message with a link to Add-ons.
- Available Brokers (right) — search 100+ brokers and connect a new one.
Copy Trading Advanced
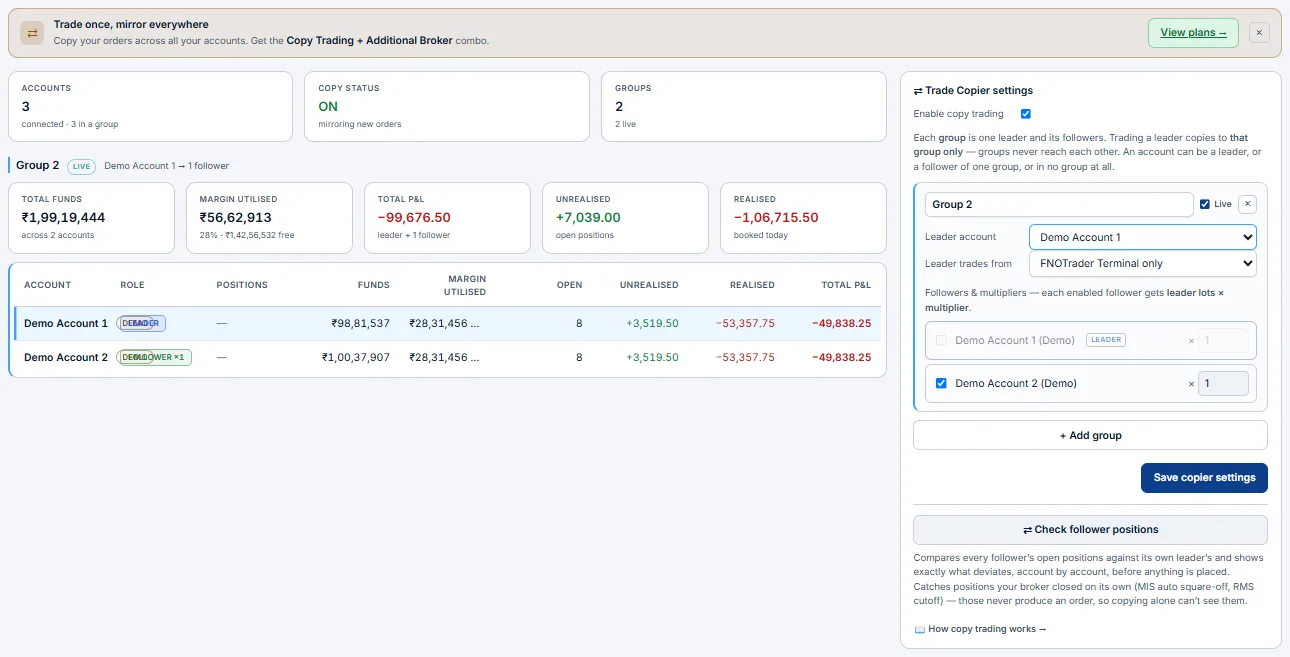
Trade once, mirror everywhere. Copy trading repeats one account's orders on your other accounts. You set up groups: each group has one leader and its followers, and each follower has a multiplier — follower lots = leader lots × multiplier, in whole lots. Trading a leader copies to that group only; groups never reach each other. An account can be a leader, a follower in one group, or in no group.
Set it up — Trade Copier settings
Open ⚙ → ⇄ Trade Copier or the Copier tab:
- Enable copy trading — the master switch for every group.
- Group — a name, a
Livetick (untick to pause just this group) and×to remove it.+ Add groupadds another. - Leader account — the account you trade on. Leader trades from —
FNOTrader Terminal only, orBroker terminal too, which also watches the leader's own broker order book so trades you place in the broker's app get copied. - Followers & multipliers — tick each follower and set its whole-lot multiplier. The leader's own row is disabled.
Save copier settings— stores it on the server.
How it fires & how you monitor it
- One order, many accounts — every order on the leader (ticket, basket, chart, or a guard's auto-exit) is placed on each follower too. The result is reported per account —
LEADER/FOLLOWER,PLACED/FAILED/SKIPPED. A retried click never places twice. - Exits copy too — squaring off on the leader squares off the followers.
- Group dashboard — accounts, copy status and live groups; then total funds, margin used, total, unrealised and realised P&L; and a per-account table (role, funds, margin, open positions, P&L).
- Check follower positions — compares every follower's open positions with its leader's and lists each difference before anything is placed. This catches positions a broker closed on its own (MIS auto square-off, RMS cut-off), which never produce an order to copy.
SKIPPED; one that isn't logged in FAILEDs for that account only — the others still go through. Copy trading is a paid add-on, and every follower must be a connected, enabled account (it uses a broker slot).3 · Alerts
The watch-and-notify layer that bridges analytics and execution. You cannot watch every strike all day — an alert does it for you: configure a precise rule once and the engine evaluates it at every 1-minute bar close and pings you the instant it fires — or, if you arm it, places the order for you. Alerts run server-side, so they keep working with the browser tab closed.
Alerts — your second pair of eyes Beginner Intermediate Advanced
Configure the condition once — the engine evaluates it at every 1-minute bar close (HH:MM:02 IST) during NSE F&O market hours only (09:15–15:30 IST on weekdays, NSE holidays skipped) — and pings you the moment it fires via in-app toast, sound, Telegram, WhatsApp and/or webhook. Alerts persist server-side, survive browser restarts, and keep running when this tab is closed. After 15:30 the engine goes idle and resumes automatically at 09:15 the next trading day, so post-close prints (auction, late ticks) do not trigger fires.
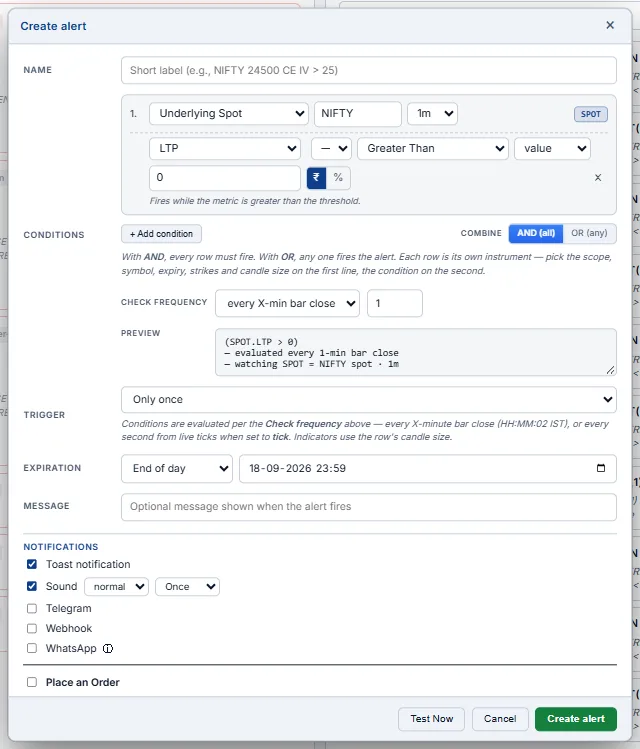
Test Now checks the conditions against live data.The four trader scenarios alerts solve
| Scenario | What you want | Alert recipe |
|---|---|---|
| Entry trigger | "I'll buy if NIFTY breaks above 24,100 on a closed bar." | Spot · LTP Crossing Up 24,100 · Only once · Sound + Toast |
| Position management | "I'm long 24,200 CE at ₹110. Alert me at stop (₹70) or target (₹180)." | Option (CE) · LTP ≤ 70 OR LTP ≥ 180 · Only once · Telegram |
| Vol / regime change | "Tell me when ATM straddle premium compresses under ₹80 — IV got crushed." | ATM Straddle · LTP ≤ 80 · Only once · Loud sound + Webhook to your auto-trader |
| Hands-off monitoring | "Recurring ping every bar the trade is still in profit so I know it's safe to step away." | Straddle (short) · LTP New Day Low · Per minute · Toast |
Step 1 — Pick the right scope
Scope is "which instrument the engine is watching." Picking the wrong scope is the most common reason an alert never fires — choose for the question you're actually asking.
| Scope | Use when… | What gets watched |
|---|---|---|
| Spot | You want a level alert on the underlying index/stock. | The cash index price (e.g. NIFTY 24,026). |
| Future | You trade futures and care about basis vs spot. | The expiry-specific futures LTP plus computed basis. |
| Option (CE / PE) | You're tracking a specific CE or PE position — say your long 24,200 CE. | One leg at one strike. Has IV and full Greeks (Δ, Γ, Θ, ν). |
| Straddle (fixed strike) | You hold or want to hold a straddle at a specific strike that won't drift. | CE+PE combined premium at one fixed strike. |
| Strangle (fixed strikes) | You sold a strangle — say 23,900 PE + 24,200 CE — and want to monitor combined mark-to-market. | OTM Put + OTM Call combined premium at two fixed strikes. |
| ATM Straddle (rolling) | You're sensing implied move / volatility, not a position. The strike auto-rolls as spot moves so the alert never goes stale. | The canonical "ATM" rolling token published by the data feed. Strike re-resolves every bar. |
| Custom | Multi-leg strategies — iron condor, calendar spread, broken-wing butterfly — where you watch net P&L of the whole structure. | You define N legs with signed ratios; engine sums them per bar. |
ATM Straddle (rolling) re-resolves the strike every minute. Today's 24,050 ATM may be tomorrow's 24,100 ATM. Pick this for vol/regime monitoring where the concept of "current ATM premium" matters, not a specific contract.
Step 2 — Pick the parameter
Parameter is "which number on that instrument to watch." Which params are exposed depends on scope (single options have IV + per-leg Greeks; combined scopes have net Greeks but no IV).
| Parameter | Trader's use |
|---|---|
LTP | The price itself. Most level-based alerts read this — stop-loss, target, breakout. |
LTP Chg / LTP Chg % | Day move vs prev close. "Wake me when CE doubles" → LTP Chg % ≥ 100. |
OI / OI Chg / OI Chg % | Position build-up signal. Sudden big OI increase on a strike = institutional flow. Combine with LTP Chg % for buildup classification. |
Volume / Vol Chg / Vol Chg % | Activity spikes. Unusual volume = something is happening on that contract. |
IV / IV Chg / IV Chg % | Implied vol. "Alert me on IV pop" before an event = IV Chg % ≥ 20. (Option scope only — per leg.) |
Day High / Day Low | Engine-tracked running extremes since the alert was created. See the baseline section below. |
Delta | Directional exposure of one option leg. Long an ATM CE for gamma scalping? Fire at Delta ≥ 0.7 — you're now significantly directional. |
Gamma / Theta / Vega | Pro/quant alerts on Greek extremes (e.g. theta-burn warning for ATM straddle sellers). |
Net Delta / Net Theta / Net Vega | Greek totals for combined scopes. "Sound my buzzer when my short strangle's net delta drifts past ±0.20" = a hedge alert. |
Buildup | Categorical: Long Buildup / Short Buildup / Long Unwind / Short Covering / Neutral. Computed from LTP Chg × OI Chg sign. Use the = operator with a string value. |
CDV | Cumulative delta volume — net aggressive buy minus sell pressure. Direction-of-flow signal at the option level. |
Basis / Basis % | Futures premium over spot. Cash–futures arbitrage alerts; cost-of-carry shifts. |
How "Day High / Day Low" actually works (read this once)
This is the most common point of confusion. The engine does NOT use the broker-reported day high/low. Instead:
- When you create the alert, the engine captures the current LTP as the starting day high AND day low.
- Every minute thereafter, the running high is the max of (running high, this bar's LTP). Running low is the min, symmetrically.
- At IST midnight, both reset to the next day's first observed LTP.
This means "new day low" fires when LTP drops below the lowest LTP the engine has seen SINCE THE ALERT WAS CREATED, not the actual day's low recorded at 09:25 before the alert existed. The same applies to "new day high".
Step 3 — Pick the operator
Operators come in two families: level triggers (true any bar the condition holds) and edge triggers (true only on the specific bar where the transition happened).
Level triggers (every matching bar fires)
| Op | Fires when | Trader use |
|---|---|---|
| ≥ / > | value reaches or exceeds threshold | Target hits, breakout above resistance |
| ≤ / < | value falls to or below threshold | Stop-loss, breakdown below support |
| = / ≠ | value equals / doesn't equal threshold | Categorical params (Buildup = Long Buildup) |
Edge triggers (only the bar that crossed/transitioned fires)
| Op | Fires when | Trader use |
|---|---|---|
| Crossing Up | last bar was below, this bar is above | Clean breakout entries (no chatter while sitting at the level) |
| Crossing Down | last bar was above, this bar is below | Breakdown entries / trail-stop hits |
| Crossing (either) | either of the above | Range break in either direction |
| Entering Channel [lo, hi] | last bar outside the band, this bar inside | Mean-reversion: price returning into a VWAP±2σ band |
| Exiting Channel [lo, hi] | last bar inside, this bar outside | Range breakout from morning consolidation (24,020–24,050) |
| New Day High | LTP prints a fresh running max | Strength continuation, trailing-extreme signal |
| New Day Low | LTP prints a fresh running min | Weakness continuation; or "my short straddle just made a new profit low" |
| Moving Up Δ / N bars | value rose by ≥ Δ (pts or %) across the last N×interval bars | Momentum acceleration — "CE rose 30% in 5 minutes" |
| Moving Down Δ / N bars | value fell by ≥ Δ over the same window | Momentum decay — "ATM straddle dropped 20 pts in 10 minutes" = vol crush |
LTP ≥ 24,100 with trigger=Per minute fires every single
bar NIFTY stays above 24,100. Use it for monitoring ("ping me as long as we're still above") or
with trigger=Once for one-shot stop/target hits.Crossing Up at
24,100 fires exactly once per breakout, regardless of trigger
mode — the bar where it crossed. Use this for clean entries (no spam if price oscillates).Step 4 — Combine with logic (AND / OR)
- AND (all) — every condition must be true on the same bar. Use for setups requiring confluence: "Crossing Up 24,100 AND CDV ≥ +5,000" (price break with confirmed buying).
- OR (any) — one is enough. Use for position guards: "LTP ≤ 70 OR LTP ≥ 180" (stop OR target — whichever first).
For Option scope with side=BOTH, CE and PE each evaluate the conditions independently — so a "BOTH" alert can produce two separate fires per bar (one for CE, one for PE).
Step 5 — Trigger mode + expiration
- Only once — fires once, then auto-disables. Re-enable manually if you want it back. Use for stop-loss / target hits, one-shot entries, "alert me when…" style.
- Per minute — re-armed every bar; fires as often as conditions match. Use for monitoring ("ping me every bar the trade is in profit"), recurring rules, "I'm not at the screen but want a heartbeat".
Every alert has an expiry timestamp; the engine auto-disables it at that moment. Default is "End of day" (today 23:59 IST) — the right choice for most intraday alerts. Use "End of week" / "End of month" for positional alerts, "Custom" for event-specific timing (e.g. an FOMC alert that expires at 23:30 on the day of the meeting).
Step 6 — Notifications
| Channel | When to use |
|---|---|
| Toast | Top-right popup in any open browser tab. Auto-fades after 7s; the fire is also appended to the LOG tab regardless of the toggle. |
| Sound | You're at the screen but not staring at it. Pick loud+loop (4-beep alarm) for can't-miss alerts. |
| Telegram | You're away from the terminal. One-time bot setup via @BotFather: create a bot, copy the token + chat ID into the modal. Credentials persist across all your alerts — set them once. |
| Delivered through the platform's WhatsApp channel to your registered number (subject to the 24-hour messaging window). Good for can't-miss fires when you live in WhatsApp. | |
| Webhook | Machine consumers — your auto-trader, a logging server, a Discord/Slack integration. POST with an optional JSON body template; variables like {symbol}, {strike}, {ltp}, {message}, {fired_at} are substituted. 5s timeout, no retry. |
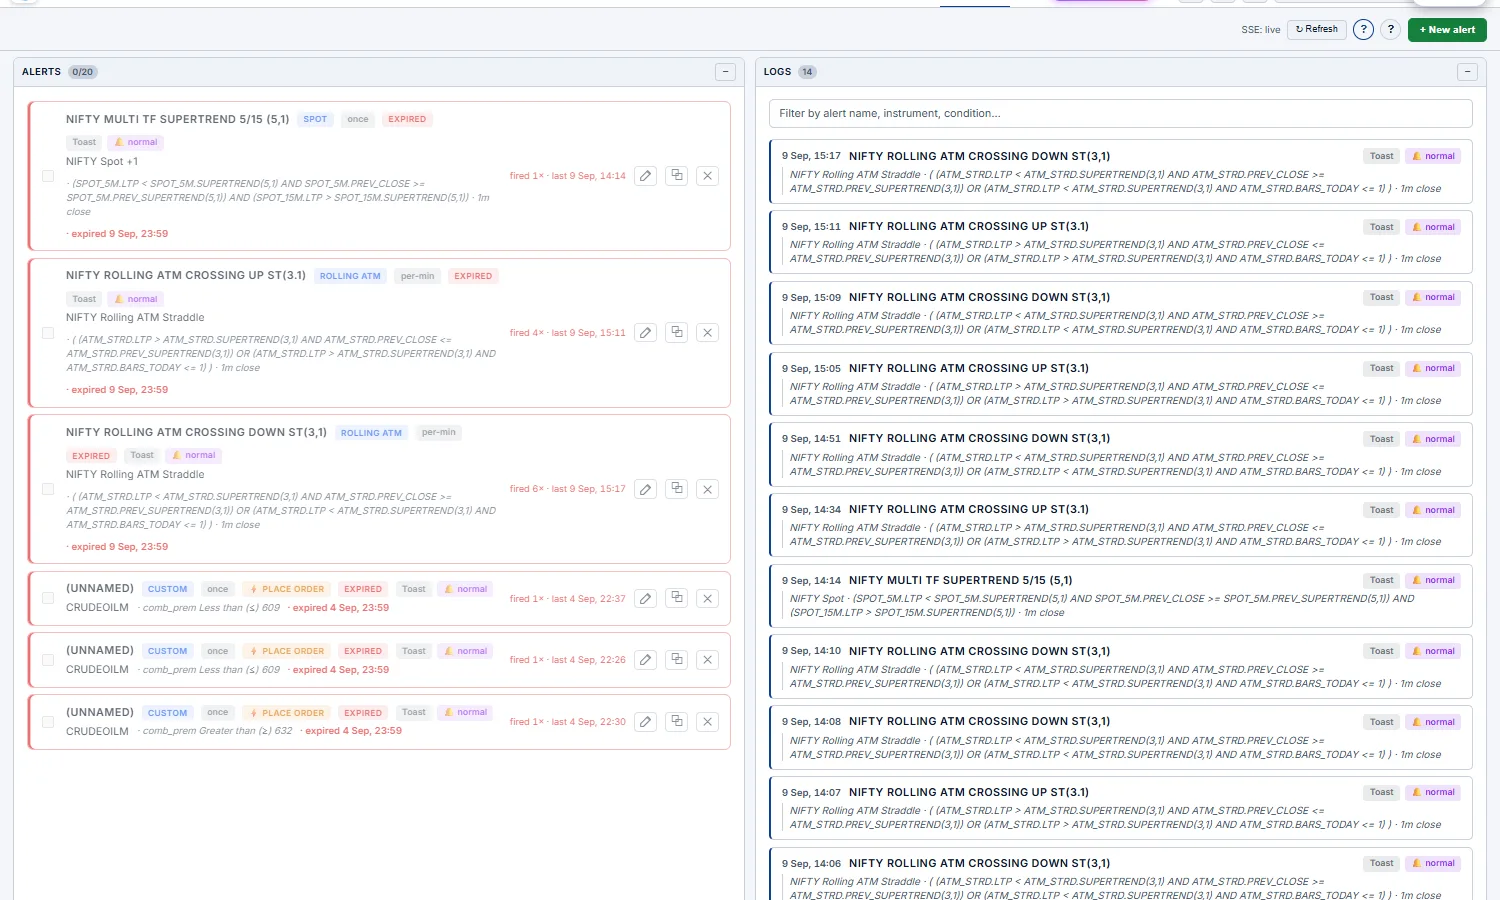
FT<your portal ID>_bot
(e.g. FT8507_bot) to keep it personal and discoverable. The "?" button next to the
Telegram inputs in the modal shows the exact copy-paste commands.Worked examples — actual trader recipes
Example 1 — Stop-and-target on a long CE
You bought NIFTY 24,200 CE at ₹110. Risk-reward: stop at ₹70 (loss = 40), target at ₹180 (gain = 70). You want one alert that fires whichever hits first, so you can switch tabs to your broker and exit.
- Scope: Option · NIFTY · 24,200 · Side CE
- Logic: OR (any)
- Conditions:
LTP ≤ 70·LTP ≥ 180 - Trigger: Only once
- Notifications: Toast + Sound (loud, loop) + Telegram
Example 2 — Vol-crush exit for short ATM straddle
You sold the ATM straddle for ₹120 of premium first thing in the morning. You want out the moment IV gets crushed and the premium falls to ₹80 (a clean 40-point profit).
- Scope: ATM Straddle · NIFTY · weekly expiry (the engine auto-rolls if the ATM strike drifts)
- Condition:
LTP ≤ 80 - Trigger: Only once
- Notifications: Toast + Sound (loud, once) + Telegram
Example 3 — Range breakout (Spot · Exiting Channel)
NIFTY has been chopping 24,020–24,050 all morning. You want to take the breakout in either direction the instant it closes outside the range on a 1-minute bar.
- Scope: Spot · NIFTY
- Condition:
LTP Exiting Channel [24,020, 24,050] - Trigger: Only once
- Notifications: Sound (loud, loop) + Webhook to your auto-trader so it can react in seconds
Example 4 — Trail stop on a winning short strangle
You sold the 23,900 PE + 24,200 CE strangle for ₹140 combined. You want a recurring "every bar this is making a new low in premium, ping me" — so you can decide when to lock profits.
- Scope: Strangle · NIFTY · Put 23,900 · Call 24,200
- Condition:
LTP New Day Low - Trigger: Per minute (re-armed each bar)
- Notifications: Toast (no sound — passive update)
Example 5 — Gamma scalping signal (Option · Delta)
You're long an ATM CE with the intent to delta-hedge as the underlying moves (gamma scalping). When delta drifts past 0.7, you've become significantly directional and need to hedge or reduce.
- Scope: Option · NIFTY · 24,050 · Side CE
- Condition:
Delta ≥ 0.7 - Trigger: Only once
- Notifications: Telegram (you'll be away from screen when this fires)
Example 6 — IV-pop pre-event alert
FOMC is at 23:30 IST. You want a heads-up if IV pops >20% on the ATM CE before the event (meaning the market is starting to price in volatility — sometimes a tell that the move's already happening).
- Scope: Option · NIFTY · 24,050 · Side CE
- Condition:
IV Chg % ≥ 20 - Trigger: Only once
- Expiration: Custom — today 23:30 IST
- Notifications: Telegram
Example 7 — Momentum acceleration (Moving Up)
You want to know when a CE you're tracking pops 30% within 5 minutes — a signal of aggressive directional flow on that specific strike.
- Scope: Option · NIFTY · 24,100 · Side CE
- Condition:
LTP Moving Up 30%· 5 bars · 1m interval - Trigger: Only once
Example 8 — Iron condor P&L exit (Custom scope)
You sold a 23,900/23,800 put spread + 24,200/24,300 call spread (4-leg iron condor) for ₹55 of net credit. Want out when the net debit to close drops to ₹25 (60% profit) OR if it rises to ₹90 (loss too big).
- Scope: Custom — 4 legs, signed ratios (long −1 / short +1 per side)
- Logic: OR (any)
- Conditions:
LTP ≤ 25·LTP ≥ 90 - Trigger: Only once
- Notifications: Telegram
Common pitfalls
- "My alert never fired" — most often the condition is structurally unreachable. Re-read Step 1 (scope) — is the engine actually watching what you think it's watching? Use the Test Now button in the modal to dry-run the conditions against current data and see exactly which conditions matched.
- "new day low fires the moment I create the alert" — won't happen. The engine seeds the running low from the LTP at creation, so the first bar can never be a new low (it equals the baseline).
- "I picked Straddle but my strike is now ITM" — that's expected. Straddle (fixed) never re-resolves. If you wanted "always at ATM", you should have picked ATM Straddle. Delete and recreate with the right scope.
- "Crossing Up didn't fire even though price went above the level" — Crossing is edge-triggered. If the previous bar was already above the threshold, no transition happened, no fire. Check the LOG to see what the previous-bar LTP was at the time.
- "Multiple alerts on the same strike, only some fire" — each alert is evaluated independently per its own conditions and logic. There's no global de-dup. Two alerts both watching
LTP ≤ 80on the same instrument will both fire. - "Telegram didn't deliver" — most often the chat ID is wrong (you need the numeric chat ID, not the username). DM
/startto your bot first, then ask@userinfobotfor your numeric chat ID and paste that in. - "Webhook silently failed" — there is no retry. If your endpoint was down for 6 seconds, the fire is lost. Use Telegram (which has Telegram's own retry) for critical alerts.
- Morning: set up recurring monitoring alerts for the regime you expect (e.g. ATM Straddle making new lows for a vol-crush day).
- When you take a position: immediately add a position-management alert (stop OR target on the legs you bought/sold).
- For setups you're hunting: add one-shot entry-trigger alerts (Crossing / Exiting Channel on the level that confirms your thesis).
- Leave the tab open or set Telegram / WhatsApp if you'll step away. The engine keeps evaluating server-side regardless.
- End of day, scan the LOG tab — every fire was logged with the exact instrument, LTP at fire, and the condition that matched. It's your audit trail for postmortem reviews.
Place an order on trigger Advanced
Let an alert pull the trigger for you. Any alert can be set to auto-place an order server-side the moment it fires — even with the app closed. In the alert's Place an Order section you choose the side (BUY/SELL), lots, product (MIS/NRML) and which broker/Demo accounts the order should hit. For a straddle/strangle alert it fires both legs (CE + PE) automatically.
- Multi-account — tick several accounts and the same order fires to each, using the same execution primitive the Terminal uses.
- "Trade live" safety gate — real (non-paper) account checkboxes stay disabled until you turn on the per-alert
Trade livetoggle. Without it, the alert only ever places on Demo accounts; the whole path is inert unless the alert has it enabled with at least one account. - Reason-logged — every fire records placed / failed / skipped per account on the alert's audit row, with plain-English reasons (e.g. "skipped — live trading not enabled on this alert", or "broker not logged in / not enabled").
Trade live on and point it at the real account.Trade live on, the order is placed automatically and unattended on your real broker account when the alert fires — there is no confirm step at fire time. Set lots and accounts deliberately and pair it with the Terminal's SL/TGT guards.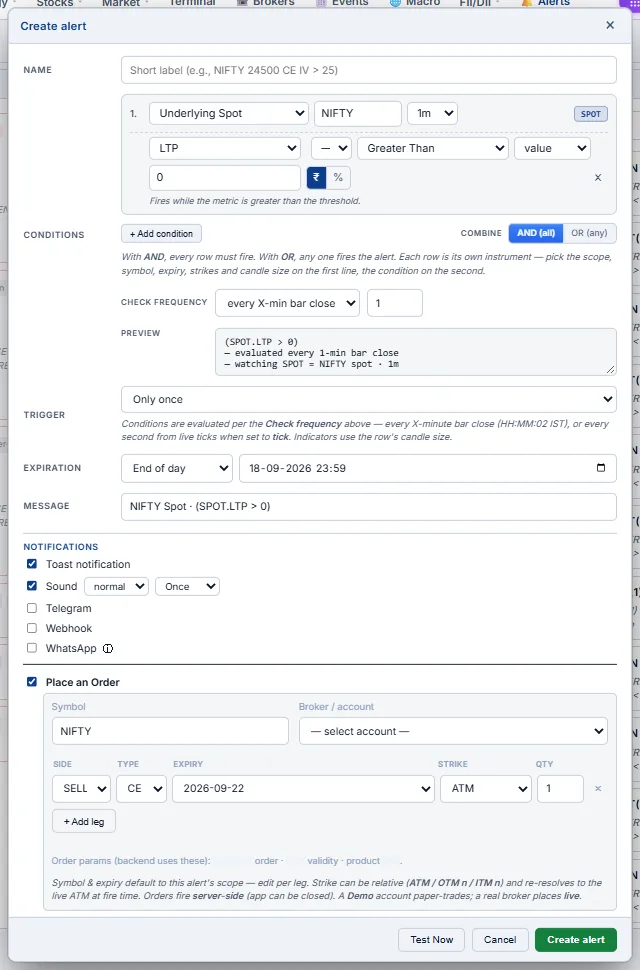
⚡ Live trade setups
The three recipes below are the most-used playbooks. Each one tells you which page to open, which signals to look for, and which trade to place when those signals line up. Read them top-to-bottom — the buying setup explains the signal language used in the others.
1. Intraday option buying Beginner Intermediate
Thesis: A specific strike has just confirmed a directional break — buy that side's option for a quick intraday move. Defined risk (premium paid), high reward if the move continues.
Pages you'll use
- Intraday Tape — primary signal scanner
- Strike Charts — confirm with the strike's own intraday chart
- Strategy Builder (optional) — size the trade and set a stop
Signals — all four ideally line up
| # | Signal | Where to see it | What it means |
|---|---|---|---|
| 1 | New day-high on a specific CE (or PE) | Intraday Tape — cell will flash; or Straddle Table chart view — that strike's CE chart breaks today's prior high | Buyers are pushing premium up. The market is repricing that strike higher. |
| 2 | PPV volume bar / volume spike on the same strike | Intraday Tape — bottom stripe of the cell turns bright (green for big up-vol, red for big down-vol; grey is filtered out) | The move came with conviction — institutional or algo participation. Not just noise. |
| 3 | VWAP flipped — price now above VWAP for CE (or below VWAP for PE) | Strike Charts (CE side or PE side) with VWAP toggle on; or the per-strike CE/PE chart in Straddle Table chart-view | Intraday trend has flipped in your favour. The dominant volume-weighted price is below the current price. |
| 4 | Spot supports the direction | Composite or Rolling ATM page — spot trending in the same direction (up for CE buy, down for PE buy) | The underlying is confirming the option-side signal. Without spot follow-through, the option move dies. |
How to enter
- Open Intraday Tape. Scan for cells flashing on a strike — especially OTM-1 to OTM-3 for the side that's running.
- Click the cell to expand the strike's CE/PE charts at the bottom. Confirm:
- Price above VWAP (for CE buy) or below VWAP (for PE buy)
- Volume bar bigger than recent average
- SuperTrend matches direction (green segment for CE, red for PE)
- Cross-check the spot direction in Composite tab.
- Switch to Strategy Builder, click Buy Call (Bullish) or Buy Put (Bearish), set strike to the one you scanned, verify Margin Required = premium × lot × multiplier.
- Execute it straight from the Builder (Paper or Real), or send a limit order at the LTP from the Option Terminal. ★ Save in Builder to monitor live P/L.
How to manage
- Stop loss = 30-40% of premium paid. ATM options decay fast; don't hope.
- Target = 60-100% of premium paid (1:1.5 to 1:2 R/R) OR exit when VWAP flips back against you.
- Time stop = if no follow-through within 30 minutes of entry, exit. Theta is killing you while you wait.
- Don't buy options based on a single signal (e.g., volume spike alone). Need 3+ aligned signals.
- Don't buy ATM options on Thursday afternoon (NIFTY/BANKNIFTY weekly expiry day) — theta crush is brutal.
- Don't average down on a losing option-buy. The position is already wrong; adding to it doubles the wrong.
2. Directional option selling Intermediate Advanced
Thesis: Same signal pattern as the buying setup — but you sell the opposite side instead. If a CE is breaking high (strong upmove), you sell PE (market thinks puts are now overpriced). Higher win rate than buying, but capped upside and unlimited theoretical downside (use spreads to cap it).
Why sell the other side instead of buying this side?
- Buying CE on a confirmed up-move requires the move to continue. Often it stalls and theta kills the long premium.
- Selling PE on the same up-move only requires spot to not crash back. You profit from theta decay even if spot just flatlines. Higher base-rate edge.
- The PE you sell will also lose value from delta (spot moving away) AND from IV crush as fear of further down-move fades.
Signals — same four, mirrored
| If the BUY setup says… | The SELL setup says… |
|---|---|
| CE day-high breaking + PPV volume spike + above VWAP + spot up | Sell OTM PE (1–3 strikes below ATM) — preferably as a Bull Put Spread to cap risk |
| PE day-high breaking + PPV volume spike + below VWAP + spot down | Sell OTM CE (1–3 strikes above ATM) — preferably as a Bear Call Spread to cap risk |
How to enter
- Confirm the signal stack on the Intraday Tape (same as buying setup).
- Switch to Strategy Builder:
- For an up-confirmed move: pick Bull Put Spread from Bullish templates (sell PE, buy further OTM PE for protection)
- For a down-confirmed move: pick Bear Call Spread from Bearish templates (sell CE, buy further OTM CE for protection)
- Verify Margin Required tile (selling needs SPAN+exposure margin from your broker). Spreads have ~80% lower margin than naked sells.
- Verify the POP stat tile shows ≥ 60% (probability of profit). If lower, the trade isn't worth the capped reward.
- Execute all legs together with the Builder's Execute (all-or-nothing — a failed leg is unwound), or stage them in the Terminal Basket and fire in one shot. ★ Save in Builder.
How to manage
- Profit target = 50% of max profit. Don't squeeze the last drop — risk/reward turns against you near expiry.
- Stop loss = if loss reaches 1× max profit (i.e., you've lost what you could have made), close.
- Roll trigger = if spot threatens your short strike, roll the spread further OTM (close current, open new at deeper strike).
- Time exit = always close before expiry day on Indian indices (assignment/exercise risk).
3. Non-directional option selling Intermediate Advanced
Thesis: Spot is in a tight range (no clear trend). Volatility is bleeding out. Sell ATM straddle or OTM strangle and collect time decay over 1–3 days. The classic "sell premium when nothing is happening" play.
Pages you'll use
- Composite or Rolling ATM — confirm spot is range-bound and vol is falling
- Straddle Table (Chart view) — primary signal page
- Strangle Table — alternative for wider strikes / lower margin
- Strategy Builder — size the position and check margin
Signals — all five ideally line up
| # | Signal | Where to see it | What it means |
|---|---|---|---|
| 1 | Spot in a range or drifting slightly up/down | Composite chart — spot oscillating within ~1% band over last 1–2 days | No trending order flow. Big directional moves unlikely in next 1–3 days. |
| 2 | ATM straddle premium falling intraday | Straddle page — line/baseline chart on the ATM straddle ticker. Trend should be DOWN through the day. | IV is bleeding out. Time decay is winning. Premium sellers are getting paid. |
| 3 | Straddle premium below today's VWAP | Straddle Table chart-view — Straddle column for ATM and ATM±1 strikes shows the line below the amber VWAP overlay | The current premium is below the volume-weighted day average. Sellers who entered earlier are already in profit. |
| 4 | Straddle premium below EMA10 AND EMA20 | Straddle Table chart-view — toggle EMA10 (blue) and EMA20 (purple) ON. Both should be ABOVE the price line. | Short-term and medium-term momentum are both bearish on the straddle. Sustained decay regime. |
| 5 | SuperTrend DOWN (red dotted segment) on the straddle | Straddle Table chart-view — toggle SuperTrend ON. ST line should be ABOVE the price (red colour) for ATM and adjacent strikes | The dominant trend on the straddle is down. Strong confirmation that selling premium is the right side. |
How to enter
- Open Straddle Table, switch to Chart view (toggle at top right).
- Toggle indicators: VWAP ON, EMA10 ON, EMA20 ON, SuperTrend ON.
- Look at the Straddle column for ATM and ATM±1 strikes. All five signals above should be visible at a glance.
- Switch to Strategy Builder:
- For a wide-range bias: Short Strangle (Sell OTM-3 CE + Sell OTM-3 PE) or, with defined risk, Short Iron Condor (adds long wings at OTM-6).
- For a tight-range bias: Short Straddle at ATM, or Iron Butterfly for defined risk.
- Verify in the stats tiles:
- POP ≥ 65% (range-bound trades should have high probability)
- Net Theta positive (in the bottom Greeks panel)
- Net Vega negative (you'll profit if IV falls more)
- Margin Required within your risk budget
- Drag the Target Date slider to "+1d" or "+2d" to see how the position evolves with time. Confirm green P/L at current spot if held to that date.
- Execute all legs in one shot — the Builder's Execute or the Terminal Basket. ★ Save in Builder.
How to manage
- Profit target = 30–50% of max profit. Premium-selling strategies decay fastest in the first half of their life — exit early.
- Stop loss = if straddle premium flips back above VWAP and EMA10, the regime has changed — close or roll.
- Roll trigger = if spot tests one of your short strikes, roll that side further OTM (sell next strike out, buy back current short).
- Volatility shock = if VIX jumps 10%+ in a session, exit immediately. The vega leg of the trade is now hostile.
- Time exit = always close before expiry day. Pin risk at expiry can blow up an otherwise winning trade.
Trading workflows
Concrete recipes — how to actually find a trade with this app.
Beginner: my first trade Beginner
Goal: Place a defined-risk trade with capped loss and clear thesis.
- Pick a symbol you have a view on. Type it in the search bar at top. Wait for the chain to load.
- Look at the top-of-page Sentiment chip on the Option Chain. If it matches your view (e.g., chip says Bullish and you think it's bullish), click it.
- The Suggested Strategies popover opens. Pick a Conservative · Spreads strategy with the strikes shown.
- Switch to Strategy Builder tab. Click the same strategy name in the Bullish/Bearish/Neutral grid (or build it manually with the strikes from the suggestion).
- Verify the stats tiles: Max Profit, Max Loss, Margin Required. Make sure Max Loss is something you can afford to lose.
- Open the P&L Table tab — see exactly what your P/L is at every spot level.
- If everything looks right, fire the structure straight from the Builder's Execute, or stage the legs in the Terminal Basket and execute them together.
- Hit ★ Save in the Builder so you can monitor live P/L on the Saved tab.
- Naked option selling — Sell Put / Sell Call. Unlimited risk on one side. Use the Spread variants instead until you understand margin and assignment risk.
- Buying ATM on expiry day — theta destroys ATM premium fastest near expiry. Buying ATM on Thursday morning for NIFTY weekly expiry usually loses 70%+ in hours.
- Trading without checking margin — short strategies can need ₹1L+ margin. Always look at the Margin Required tile.
Intermediate: theta-decay setup Intermediate
Goal: Sell premium with defined risk on a low-IV day, profit from time decay over 2-3 days.
- Open Rolling ATM. Look at the last 5 days of straddle premium chart. Is current straddle premium below its recent average? That's a low-IV environment — risk-on for short premium.
- Switch to Composite. Confirm spot is range-bound (no clear trend last 2 days).
- Go to Strategy Builder. Pick Short Iron Condor from the Neutral templates.
- Adjust strike widths if you want — wider wings = lower premium but lower max loss. The default ±3 / ±6 strike layout works for NIFTY weekly.
- Check the Greeks panel at the bottom. Confirm Net Theta is positive (time is on your side) and Net Vega is moderately negative (you'll profit if IV falls further).
- Drag the Target Date slider to "+2d" — see what your P/L looks like in 2 days at current spot. If it's reasonable green, the trade has positive carry.
- Execute the 4 legs together from the Builder's Execute (or the Terminal Basket). ★ Save to monitor live P/L.
- Set mental stops: close if the P/L Table shows you're at -50% of margin, or if spot moves outside your short strikes.
Intermediate: event trade (RBI, Fed, results) Intermediate
Goal: Profit from a known volatility event, regardless of direction.
- Day before event: open Strategy Builder, pick Long Straddle at ATM.
- Note the cost (Net Debit). This is your max loss.
- In the Strikewise IVs panel, manually drop ATM IV by 3-5 points (simulating IV crush after the event). See how much the position would lose.
- If the post-crush loss is acceptable AND the spot move needed to break even is reasonable (BE in stats tile), enter the trade.
- Exit: cover both legs the moment the event is announced — IV crush starts within minutes. Don't wait for the spot move.
Advanced: vol-skew condor Advanced
Goal: Sell rich PE-side IV vs. cheap CE-side IV.
- Check Option Chain top chips: IV Skew > +3 means PEs are richly priced.
- Build a Bear Call Spread + Bull Put Spread manually (asymmetric — narrower call wing, wider put wing).
- Verify Net Vega is short (you want IV to fall) and Net Theta is positive.
- Use the Target Date slider at "+5d" to see how the position evolves through the week.
- Edit the Strikewise IVs to test "what if PE IV reverts to flat" — that's where the alpha is.
Advanced: calendar spread Advanced
Goal: Profit from term-structure (near-month overpriced vs far-month) at ATM.
- Builder → click Long Calendar with Calls from Bullish templates (or with Puts from Bearish).
- The far-leg expiry auto-fills as the next available expiry beyond your current expiry. Verify in the leg editor.
- Look at the payoff: classic calendar shape — peak at ATM, drops on either side.
- The On Target Date curve (dashed blue) is critical here — calendars don't pay until time passes. Drag the date slider toward the near-leg expiry to see the peak grow.
- Greeks: Net Vega should be positive (you want IV to rise on the far leg before the near expires) and Net Theta should be slightly negative initially, turning positive as near-leg theta accelerates.
- Exit when near-leg expires worthless (best case) or when spot moves significantly away from ATM (worst case — close the spread to cap losses).
Reference
IV & standard deviation
For NIFTY at spot S with annualized IV σ and T years to expiry:
- 1 SD price move =
S × σ × √T - 1 SD daily move =
S × σ × √(1/252)≈S × σ × 0.063
Example: NIFTY @ 24000, σ = 14% (0.14), 5 days to expiry → 1 SD = 24000 × 0.14 × √(5/252) ≈ 474 points. So ~68% chance NIFTY closes within 24000 ± 474 by expiry.
The Strategy Builder shows this in the bottom-right "Standard Deviation" panel, with both 1 SD and 2 SD ranges.
OI buildup tags
Decoded from the change in OI vs change in price between the previous close and today:
| Tag | Price Δ | OI Δ | Interpretation |
|---|---|---|---|
| Long Buildup | ↑ | ↑ | New longs entering. Bullish. |
| Short Buildup | ↓ | ↑ | New shorts entering. Bearish. |
| Long Unwinding | ↓ | ↓ | Existing longs exiting. Mildly bearish. |
| Short Covering | ↑ | ↓ | Existing shorts exiting (forced cover). Mildly bullish, often violent. |
Indicators (VWAP, EMA, SuperTrend)
All four chart-bearing pages (Strike Charts, Straddle, Strangle, Tape, Builder mini-charts, Straddle/Strangle Table chart view) use the same indicator suite:
- VWAP (amber) — volume-weighted average price for today only. Resets daily at market open.
- EMA10 / EMA20 (blue / purple) — exponential moving average of close. Computed across full history (5-day fetch) so the line starts from the very first candle of today (warmed up properly).
- SuperTrend (green when up, red when down, dotted) — ATR-based trend-follower. Rendered as multi-segment so direction flips don't cause line crossings. Default settings: ATR-10, multiplier 2.
Colors & conventions
| Color | Meaning across the app |
|---|---|
| Green | Profit, bullish, BUY, up-move, today positive |
| Red | Loss, bearish, SELL, down-move, today negative |
| Blue (accent) | CE side, EMA10, target-date overlay, primary actions |
| Amber | PE side, ATM row, VWAP, headers, neutral state |
| Purple | EMA20 |
| Muted grey | Inactive, low-volume, breakeven verticals, secondary text |
Glossary
| Term | Meaning |
|---|---|
| ATM / OTM / ITM | At-the-money / Out-of-the-money / In-the-money. See primer. |
| BSM | Black-Scholes-Merton — the option-pricing formula used to reprice legs at any target date. |
| BE (Breakeven) | Spot price where strategy P/L = 0. |
| CDV | Cumulative Delta Volume — net buy vs sell volume; positive = buyers in control. |
| CE / PE | Call (CE) or Put (PE) option. |
| Δ Net Delta | Sum of Δ across all legs of a strategy. Directional exposure. |
| DTE | Days to expiry. |
| FNO / F&O | Futures & Options segment. |
| GEX | Gamma Exposure — aggregate dealer gamma. See GEX page. |
| DEX | Delta Exposure — the open book's net delta (Δ × OI × spot). See Intraday DEX. |
| Zero-gamma flip | Price where cumulative gamma crosses zero — above it moves tend to be damped, below it amplified. See Definitions. |
| Vanna / Charm | How the book's delta shifts with IV (vanna) and with time (charm). See Vanna & Charm. |
| IV | Implied Volatility — market's forecast of annualised price std-dev. |
| IV Skew | OTM-PE IV minus OTM-CE IV. Positive = puts more expensive (downside fear). |
| Lot size | NSE-mandated minimum quantity per lot. NIFTY = 65, BANKNIFTY = 35, SENSEX = 20 (changes occasionally — chain shows current). |
| LTP | Last Traded Price. |
| Max Pain | Strike at which total option-buyer payoff is minimised. Often a "magnet" near expiry. |
| OI | Open Interest — number of outstanding contracts at that strike/side. |
| OTM-N | N strike-steps out-of-the-money. E.g., OTM-2 CE for NIFTY @ 24000 is 24100 strike (2 × 50pt step). |
| POP | Probability of Profit. Lognormal estimate based on ATM IV and DTE. |
| PPV | Price-Price Volume — visualisation showing big-volume bars where price also moved decisively. |
| SPAN+Exposure margin | NSE's margin computation for short F&O positions. The Margin Required tile shows the live, broker-computed value. |
| SuperTrend | ATR-based trend indicator. |
| Theta crush | Rapid time-decay near expiry. Hits ATM hardest. |
| VIX | India VIX — NIFTY's "fear index". Roughly 30-day forward NIFTY IV. |
| VWAP | Volume-Weighted Average Price for the day. |
| Walls (OI) | Strikes with abnormally high OI on one side. Often act as resistance (CE wall) or support (PE wall). |
FNOTrader Options Analytics · Last updated 2026-09-18 · Back to app